
- NZD/USD remains subdued around 0.6190 awaiting US economic data on Friday.
- On risk appetite, NZD/USD rebounded from daily lows despite poor New Zealand GDP data.
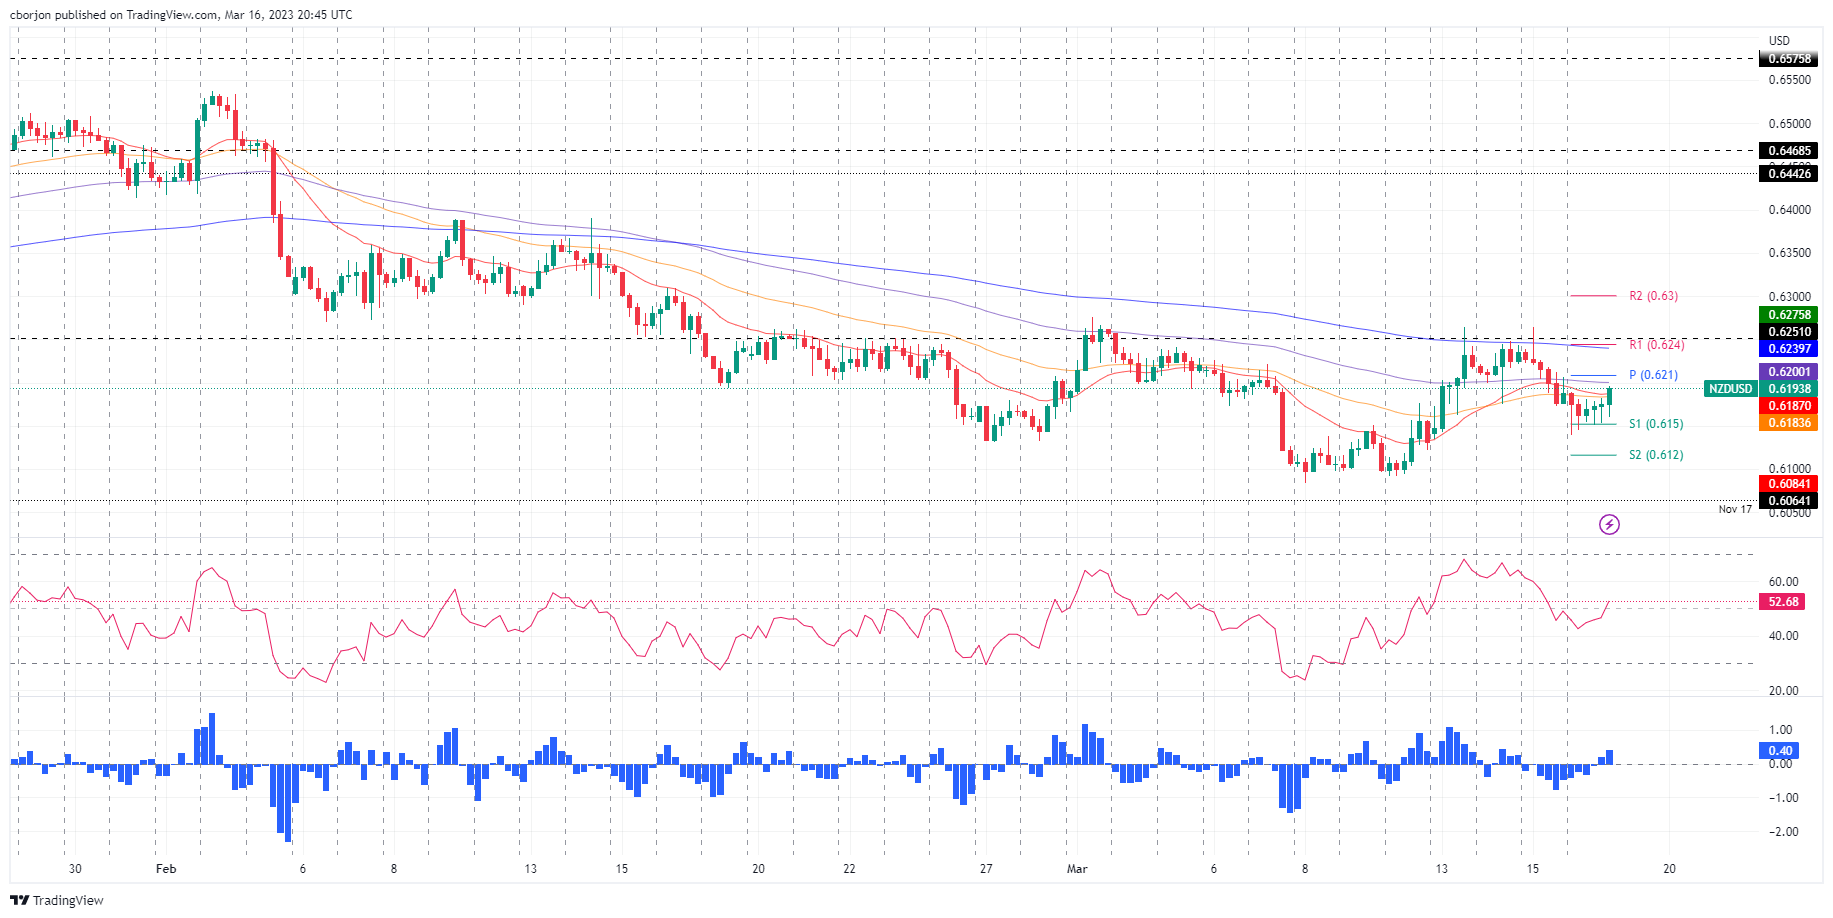
- NZD/USD Analysis: The short term is bullish, although breaking above 0.6200 will propel the pair towards the 200 DMA.
The pair NZD/USD is about to end the Thursday session flat after falling towards a daily low of 0.6139. The European Central Bank (ECB) raised rates amid turbulent times. However, news that the Swiss authorities were backing Credit Suisse and that major US banks were stepping in to help First Republic Bank eased investor fears. As a result, the NZD/USD pair has recovered and is trading at 0.6191, an advance of 0.06%.
Improving sentiment an excuse for NZD buyers to hike the exchange rate
Wall Street ended with gains of between 1.12% and 2.48%. Employment in the United States (USA), data provided by the Bureau of Labor Statistics (BLS), showed that jobless claims for the past week rose by 192,000 below estimates of 205,000, less than the week previous of 212,000. Meanwhile, data from the real estate sector, such as building permits and home construction starts, beat estimates and data from the previous month.
At the same time, the Philadelphia Fed revealed that manufacturing activity contracted at a slower rate in March.
Meanwhile, the Dollar Index, which measures the value of the dollar against a basket of six currencies, lost 0.30% to 104.430, giving NZD/USD a boost.
Earlier in the Asian session, the New Zealand dollar (NZD) weakened after the Release of New Zealand (NZ) Gross Domestic Product (GDP) for the fourth quarter, which contracted 0.6% qoq, and below the forecast Reserve Bank of New Zealand (RBNZ) MPS expansion of 0.7%.
According to analysts at ANZ Bank, “A record current account deficit in the fourth quarter, amid waning appetite for NZGBs, the Kiwi may face headwinds in the coming weeks. An interest rate hike of the Fed and/or higher points next week, coupled with less financial instability, could also make markets more USD positive.”
What is there to watch out for?
The NZ economic calendar is empty towards the end of the week. As for the monthly and annual readings, the US will release industrial production for February. MoM figures are estimated at 0.2%, up from 0% in January. In addition, the University of Michigan (UoM) Consumer Sentiment Survey will update Americans’ sentiment about the economy and revise inflation expectations.
NZD/USD Technical Analysis
The 4-hour chart of NZD/USD shows that the pair bottomed around the 0.6120 zone. In Thursday’s session, the pair’s low was around the S1 daily pivot, used as a springboard, with prices rising towards the confluence of the 20 and 50 EMAs at 0.6183-87. A break of the 100 EMA at 0.6200 and NZD/USD could test the short-term 200 EMA at 0.6239. Otherwise, a NZD/USD drop below 0.6139, and 0.6100 would be in play.
Source: Fx Street
I am Joshua Winder, a senior-level journalist and editor at World Stock Market. I specialize in covering news related to the stock market and economic trends. With more than 8 years of experience in this field, I have become an expert in financial reporting.


