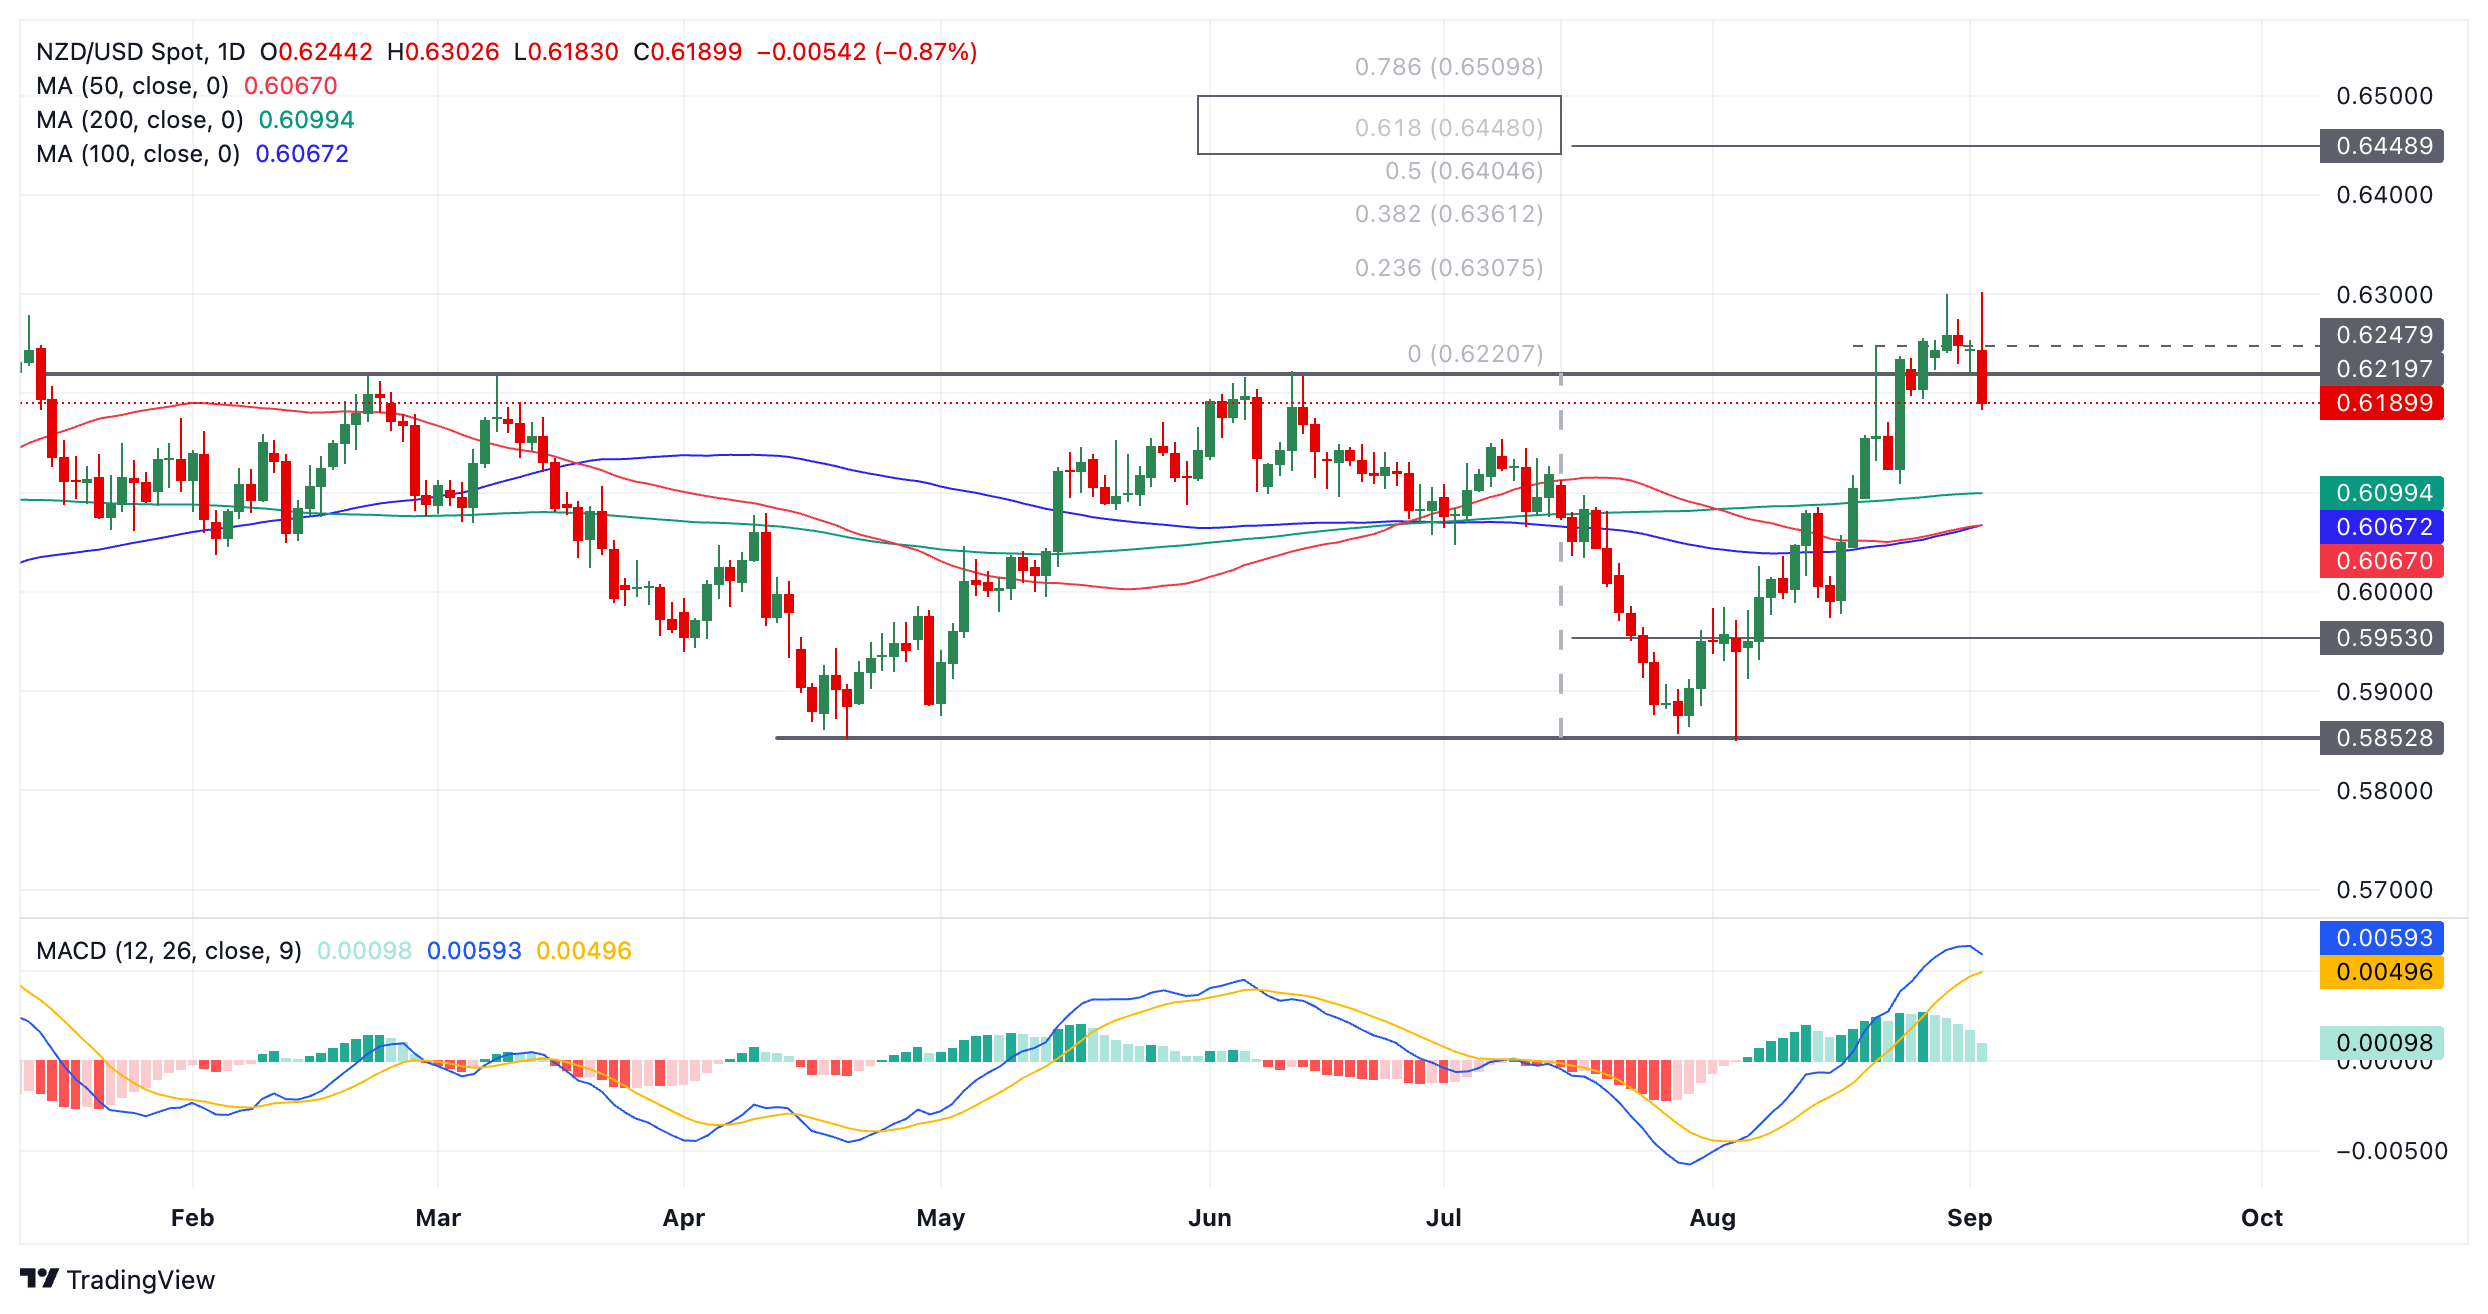
- NZD/USD could be reversing lower after a false breakout of a multi-month range.
- The pair is at a critical point: a close back inside the range could mark a surprise bearish reversal.
NZD/USD has reversed course after breaking the top of its consolidation range. It is possible that the breakout was a “fake” and the pair is now starting to fall back towards the range lows, however, it is too early to say for sure.
Despite the current weakness, the trend remains bullish on the daily chart, and since “the trend is your friend,” the odds still favor a recovery and eventual extension to higher highs.
The break above the August 20 high on August 29 and September 3 confirmed a breakout of the multi-month range. This would normally indicate substantial gains were likely on the horizon, however, the price failed to extend and instead turned around and started to break lower.
NZD/USD daily chart
Assuming the correction loses steam, the price should find a bottom and start rising again. It is likely to eventually reach its next upside target at 0.6409, the December 2023 high. This is a conservative target for the pair. The range breakout actually activated another higher target which is at 0.6448, the 0.618 ratio of the range height extrapolated to the upside.
Given the currently observed weakness and the possible trend reversal on the 4-hour chart (not shown), however, there is a risk that the breakout may have been false and the pair may now start to decline back within its familiar range.
A daily close below the top of the range, i.e. below 0.6220, would provide further confirmation of a bearish reversal. The MACD would also give a bearish signal if it closes below its signal line. A close below 0.6194 would provide even more confidence.
Source: Fx Street
I am Joshua Winder, a senior-level journalist and editor at World Stock Market. I specialize in covering news related to the stock market and economic trends. With more than 8 years of experience in this field, I have become an expert in financial reporting.


