
- WTI oil is developing a bullish extension within a descending channel.
- It is close to finding resistance at the upper channel line and the 50 SMA.
- A reversal at this point would likely lead to an extension of the downtrend and descending channel.
The price of WTI oil has been in a downtrend in a descending channel since early April. This is reflected in the 4-hour chart, which is used to analyze the short-term trend (up to 6 weeks). Since “the trend is your friend”, this is expected to continue.
More recently, WTI oil has begun a recovery rally within the descending channel and is now approaching the upper (green) line of the channel at approximately $76.20. The 50 SMA is located nearby at $76.33. These are likely to present difficult obstacles for the bulls. Assuming the channel maintains its integrity, they could trigger a downward reversal within the channel.
WTI Oil 4-Hour Chart
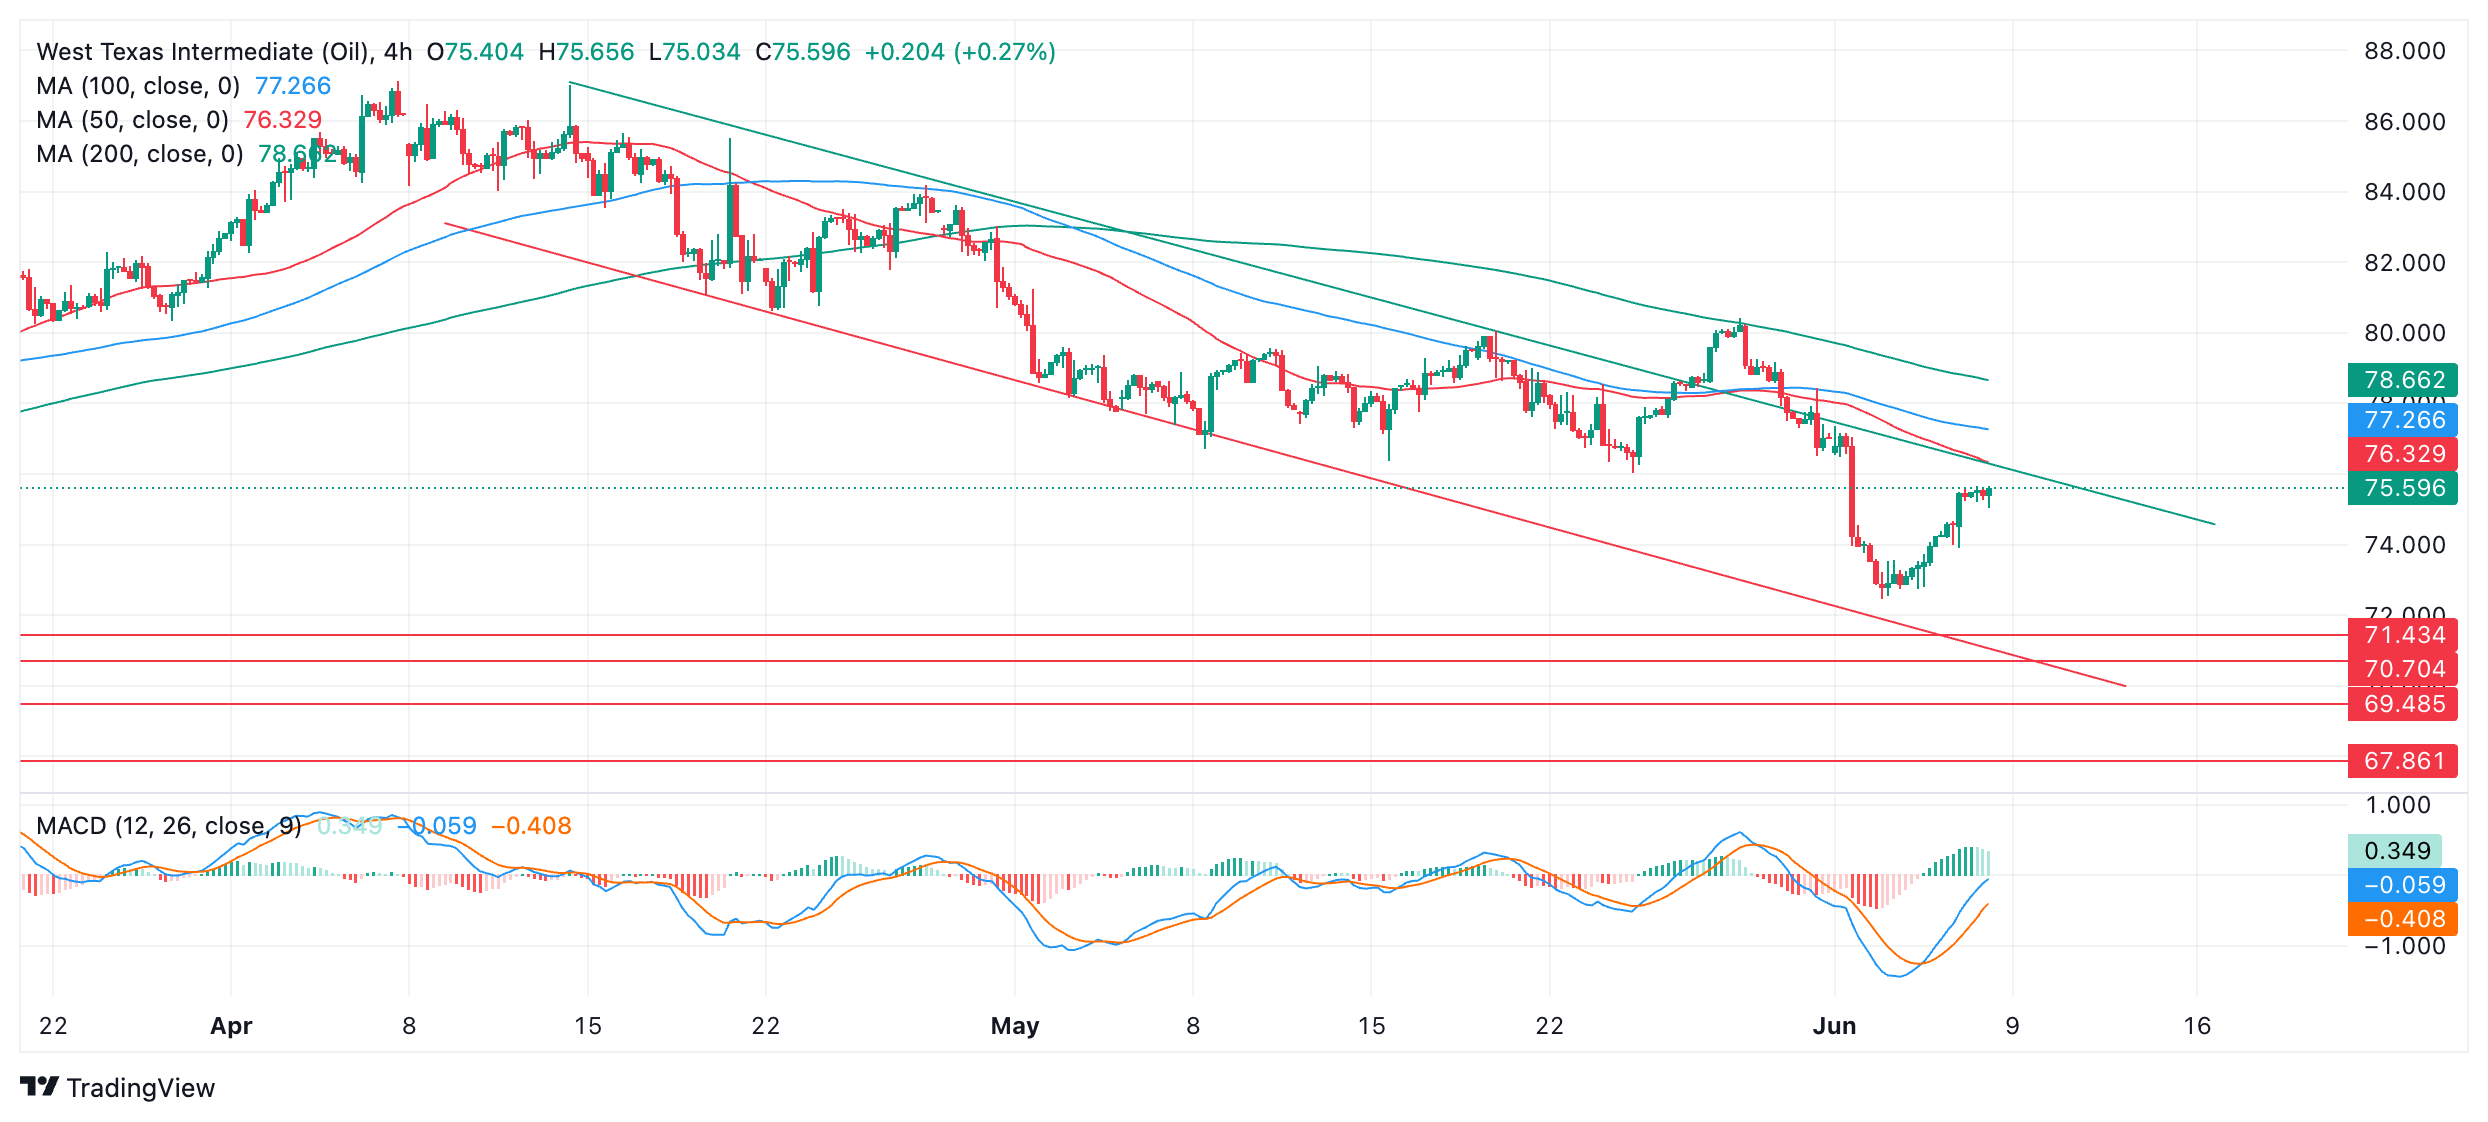
The moving average convergence/divergence indicator (MACD) is in negative territory but rising, suggesting that there is likely a bit more upside on the horizon before the next turn, likely towards the aforementioned green channel line.
Reversals in price as it moves up and down within the channel have corresponded quite reliably with the MACD crossing above and below its red signal line. If the timing continues, it suggests that if the price rises to the channel’s upper line resistance and then reverses downwards, it will be accompanied by a corresponding MACD crossover below its signal line. Such a crossover would provide supporting evidence to support the idea of a bearish reversal in line with the dominant downtrend, especially if it occurs when the MACD is above zero. A bearish candlestick reversal pattern or other similar reversal badge would also add evidence.
If this scenario plays out, the next bearish extension of the channel could initially reach $72.46 (June 4 low), followed by $71.43 (Feb 5 low) and then $70.70 (January 17 low).
The break above the channel line that occurred during the rally between May 24 and May 29 was a bullish signal, however, it suggests a higher risk that the price could break above again.
Source: Fx Street
I am Joshua Winder, a senior-level journalist and editor at World Stock Market. I specialize in covering news related to the stock market and economic trends. With more than 8 years of experience in this field, I have become an expert in financial reporting.


