
- Silver is falling steadily on the intraday charts, suggesting a short-term bearish trend at work.
- The precious metal is currently pulling back towards resistance from the bottom of a mini-range.
- It will likely reverse and begin to decline again as the pattern of lower lows continues.
The Silver (XAG/USD) is on a staggered decline on the four-hour chart after breaking below the bottom of a mini-range it formed after peaking in mid-May.
The precious metal fell to a new low of $29.12, level with the 200 simple moving average (SMA) following the release of market-moving data on Friday.
Silver 4-hour chart
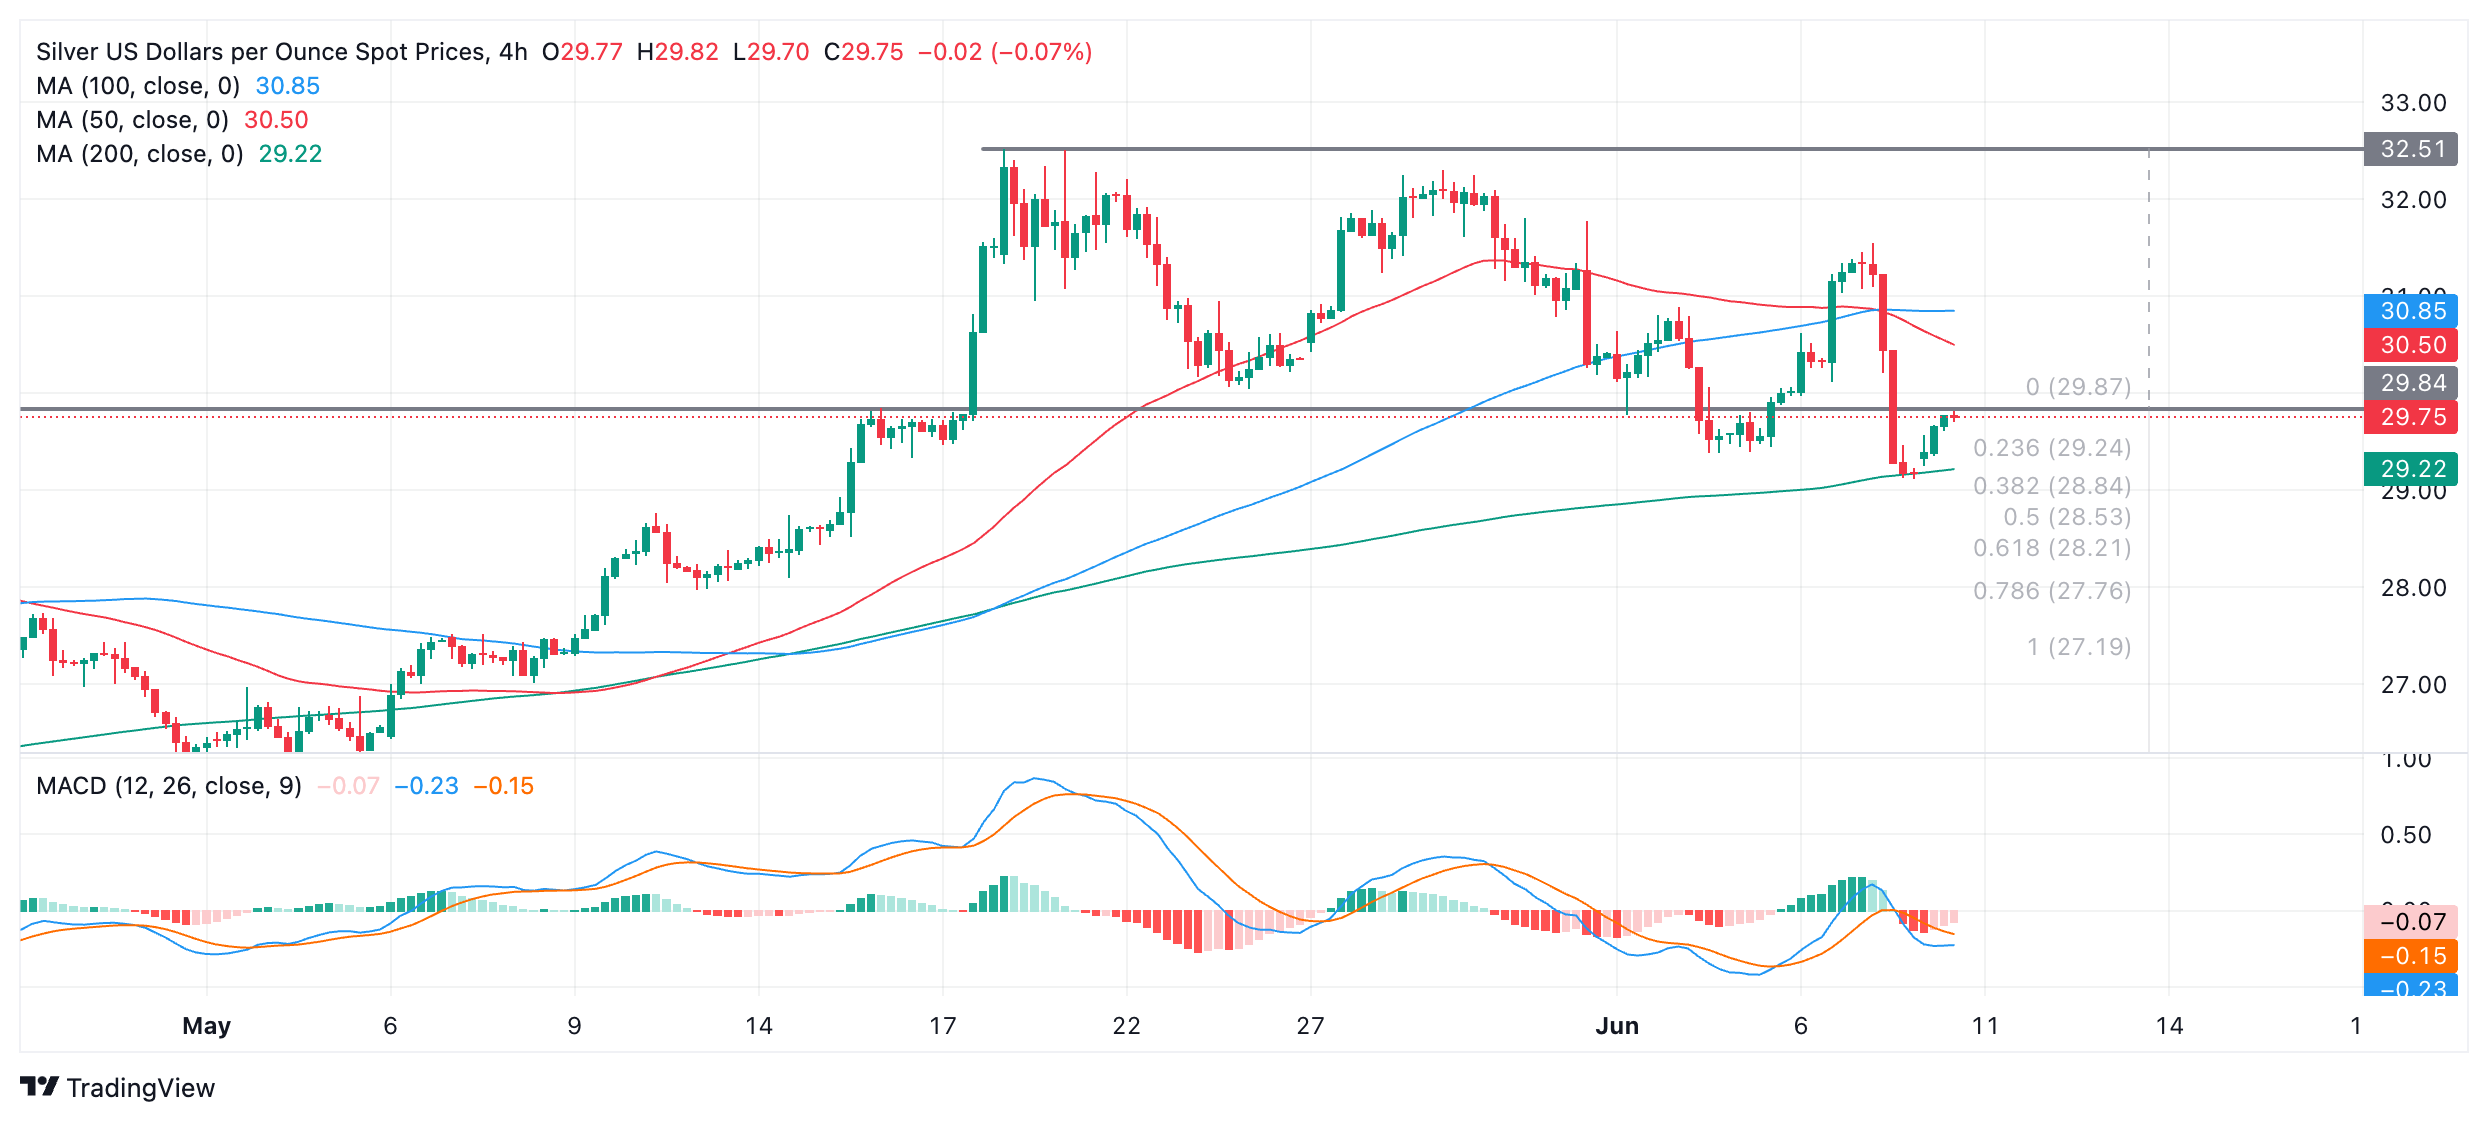
It has since retreated to resistance from the bottom of the range. Overall, silver looks bearish in the short term and the price will likely reverse and continue lower.
A break below $29.12 (June 7 low) would confirm a lower low and likely a move towards an initial target at $28.21. This is the 0.618 Fibonacci ratio of range height extrapolated downwards, the normal method for setting targets after range breakouts. Further downtrend could see silver even reach the $27.19 level, the 100% extrapolation of the range height down.
Alternatively, a move above the higher low of $31.55 would call into question the short-term downtrend and suggest the possibility of a recovery to the range high at $32.51.
Source: Fx Street
I am Joshua Winder, a senior-level journalist and editor at World Stock Market. I specialize in covering news related to the stock market and economic trends. With more than 8 years of experience in this field, I have become an expert in financial reporting.


