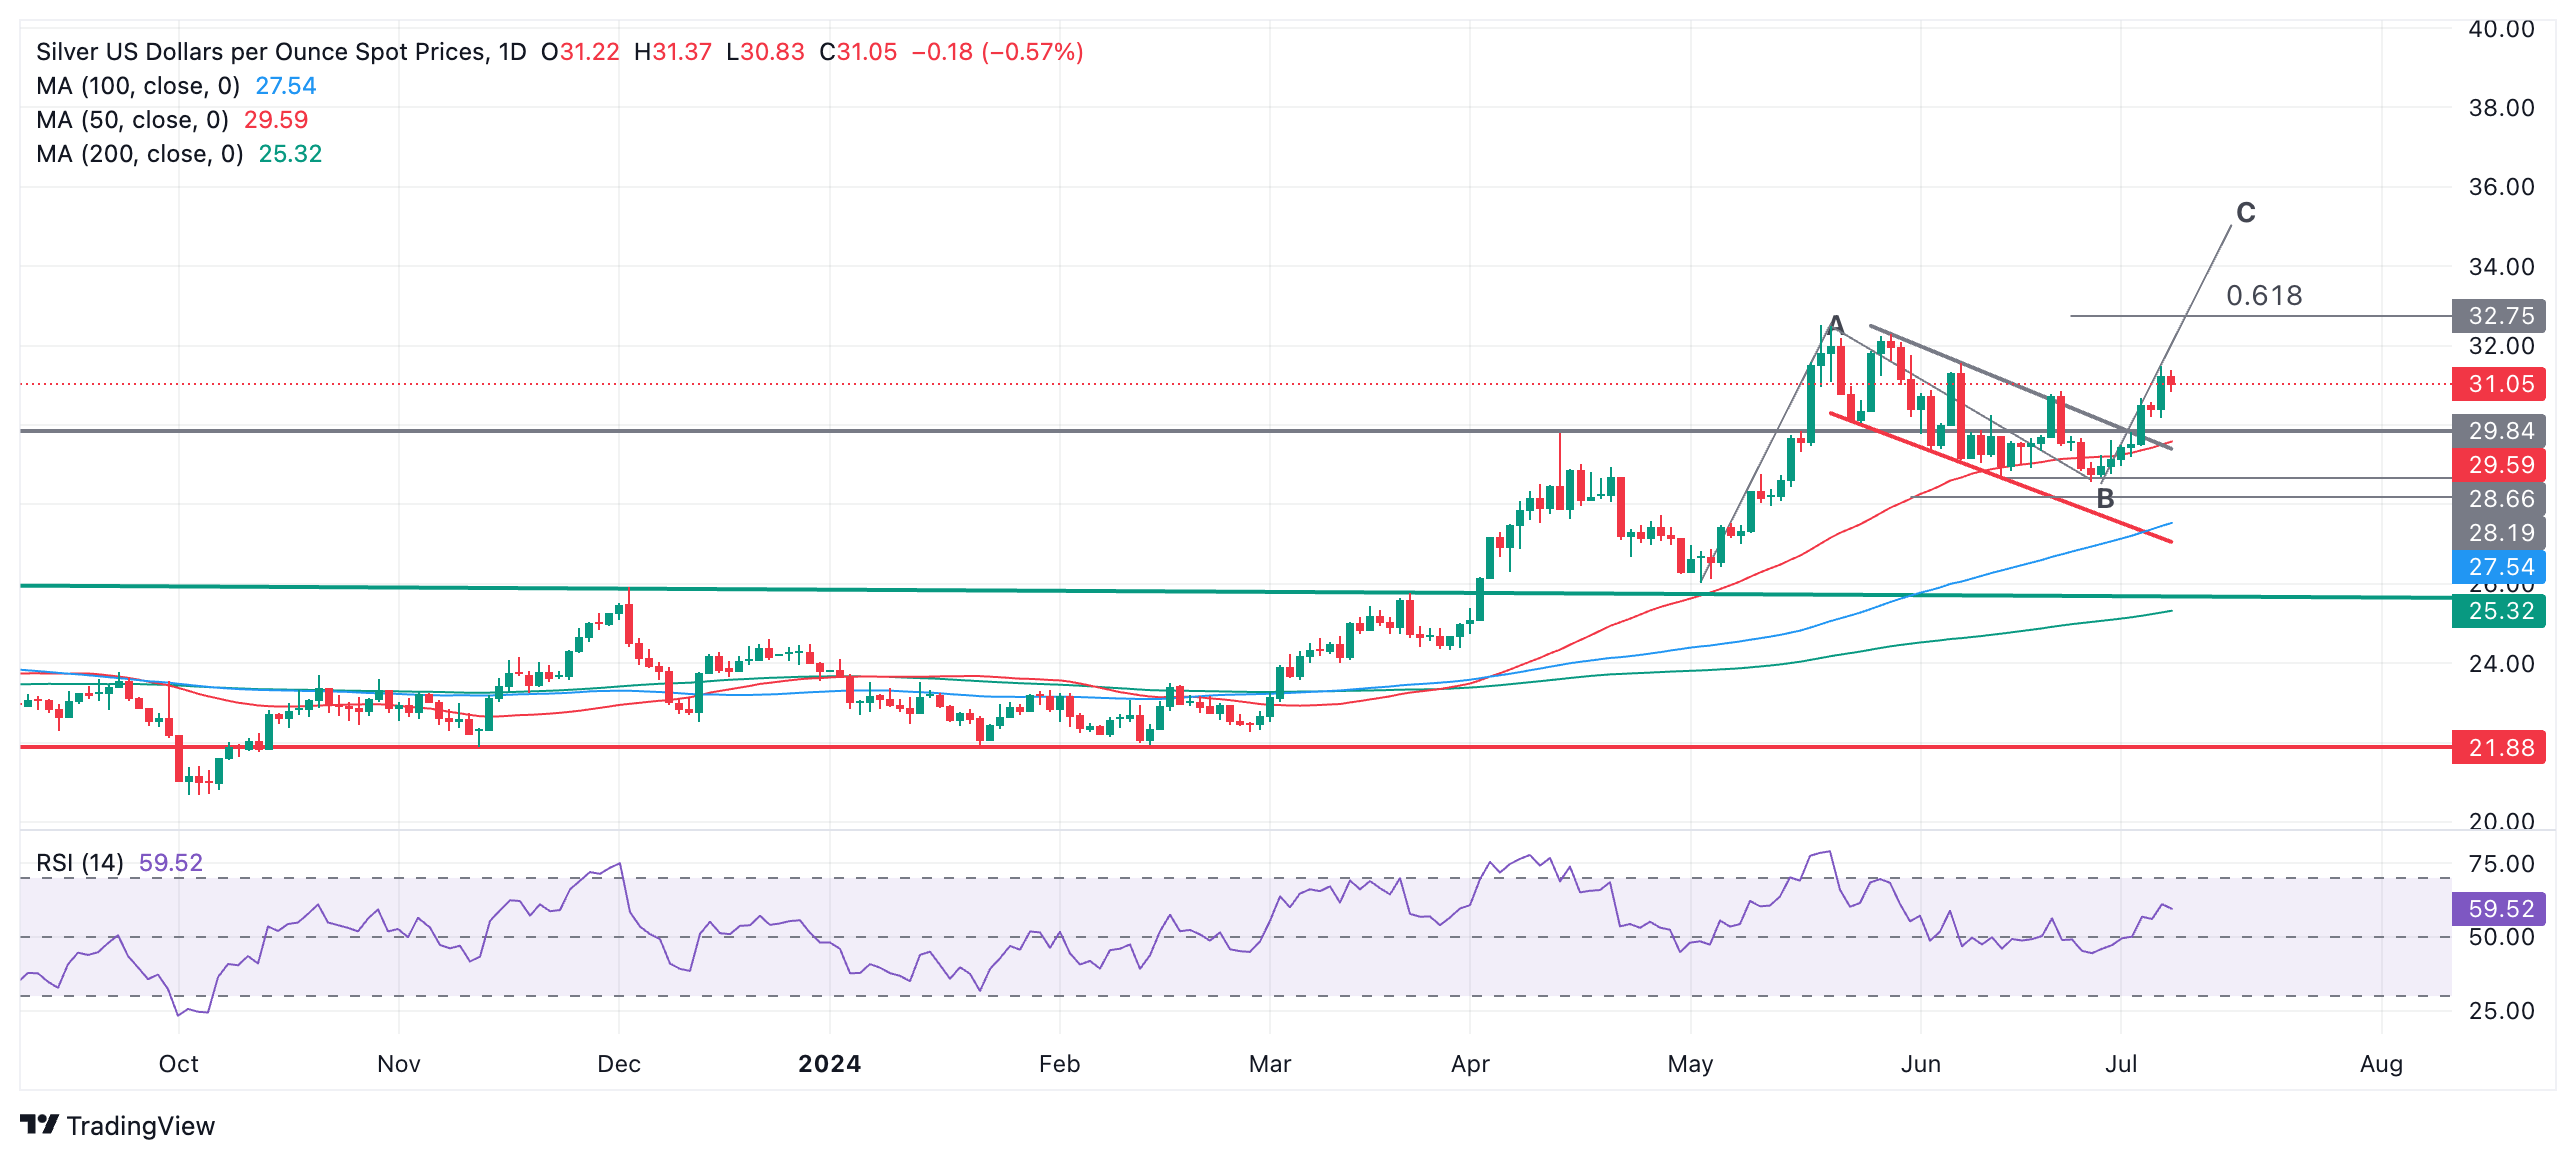
- Silver has broken out of the downward channel it was in and is recovering.
- It could be in wave C of a measured move, indicating that it has more room to rise.
- Silver is likely in a short-term uptrend now, with odds in favor of further upside.
The Silver (XAG/USD) has decisively broken out of the descending channel it was in during the second half of May and June. This is a bullish sign and suggests that the pair is now in a short-term uptrend. Since “the trend is your friend”, the odds favor an upward continuation.
Silver Daily Chart
Another bullish signal is that Silver is likely forming a measured movement (MM) price pattern. MMs are composed of three waves, sometimes labeled A, B, and C; they resemble large zigzags.
Interpreted as an MA, the rally in early May could be considered its wave A, the entire descending channel its wave B, and the breakout of the channel the start of wave C.
At the very least, wave C will likely reach the 0.618 extrapolation of wave A at $32.75. If wave C is the same length as A – as is often the case – then it could reach $35.00.
Silver has also now broken above a major resistance level at the top of a four-year consolidation zone, a longer-term bullish indication.
Source: Fx Street
I am Joshua Winder, a senior-level journalist and editor at World Stock Market. I specialize in covering news related to the stock market and economic trends. With more than 8 years of experience in this field, I have become an expert in financial reporting.


