
- Silver gains ground on Thursday and hits its highest level since early February.
- The technical situation favors the bulls and supports the prospect of a further appreciation move.
- A convincing break below the $22.00 level is needed to negate the constructive short-term outlook.
The price of silver (XAG/USD) moves higher on Thursday and reaches highs of almost two months during the first part of the European session. The white metal is currently hovering around the $23.60-$23.65 zone, up more than 1% on the day, and looks set to extend its recent rally from just below the psychological $20.00 level. , or the annual minimum touched at the beginning of March.
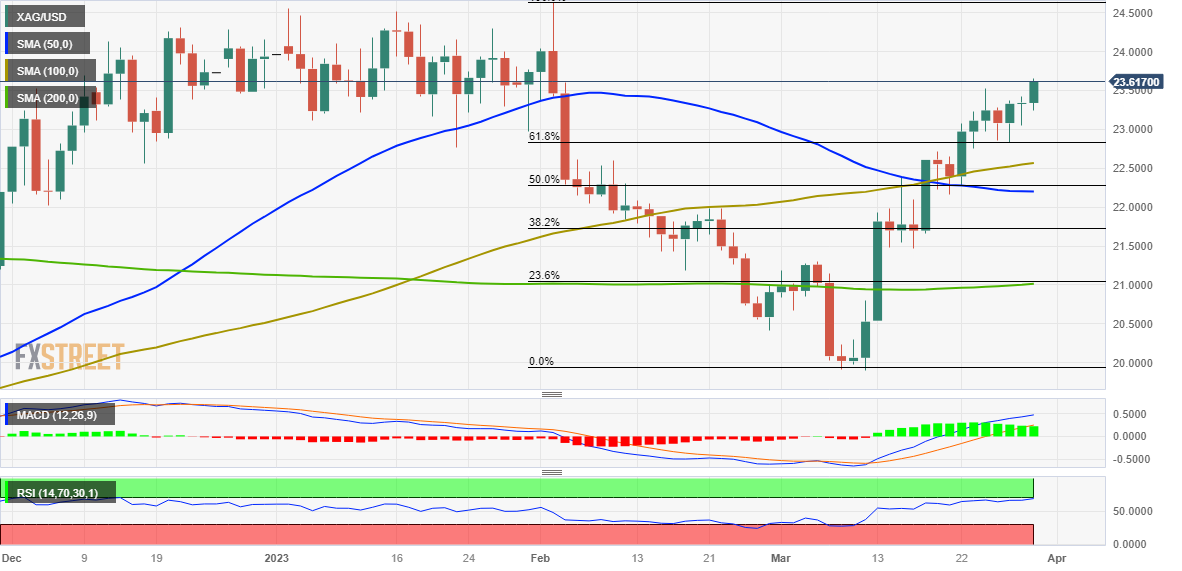
Against the backdrop of the recent break above the 61.8% Fibonacci retracement from the nine-month high, the current positive move reinforces the bullish outlook for XAG/USD. Therefore, some continuation strength, looking towards the $24.00 level again, looks like a distinct possibility. Momentum could extend further towards the $24.65 area (multi-month high made in February) on the way to the psychological $25.00 level.
That being said, the Relative Strength Index (RSI) on the 1 hour chart is already showing overbought conditions and is holding near 70 on the daily and 4 hour charts. Therefore, it is prudent to wait for short-term consolidation or a moderate pullback before opening any new bullish positions. However, any significant corrective decline could now be seen as a buying opportunity near the $23.00 level and remain capped near the 61.8% Fibonsci breakout point around the $22.80 area.
This last level should now act as a solid base and major point, which if broken decisively could trigger some technical selling. A further drop below the $22.50 zone could drag XAG/USD towards the $22.20 intermediate support on its way to the $22.00 round level. It is closely followed by the $21.75-$21.70 area. A convincing break below said support levels is needed to negate the positive outlook and shift the short-term bias in favor of the bears.
silver daily chart
Silver additional technical levels
Source: Fx Street
I am Joshua Winder, a senior-level journalist and editor at World Stock Market. I specialize in covering news related to the stock market and economic trends. With more than 8 years of experience in this field, I have become an expert in financial reporting.


