
- Silver prices (XAG/USD) are struggling to maintain the bullish momentum that began last Monday, currently facing consecutive days of losses.
- The formation of a “tweezers-top” chart pattern on XAG/USD suggests potential for further decline, with the current price at $23.48, down 0.92%.
- If the sellers remain in control and keep the price below $24.00, a pullback towards the 200-DMA area is likely, with a possible further decline towards $23.00.
The price of the Silver struggles to extend its recovery that began last Monday, posting consecutive days of losses, due to a risk-on impulse, despite the general weakness of the US Dollar (USD) across the board. From a price action standpoint, XAG/USD formed a “tweezers-top” chart pattern, ensuring that further bearish action is expected; Therefore, XAG/USD is trading at $23.48, losing 0.92%.
After forming the tweezers top, A daily close above the latter could open the door to retesting $24.00.
On the other hand, if sellers intervened and kept prices below $24, the chances of a pullback to the 200 DMA area, followed by $23.00, would increase. Below that level, further decline is expected, exposing the latest cycle low at $21.88, the November 13 low.
Analysis of the price of Silver – Daily Chart
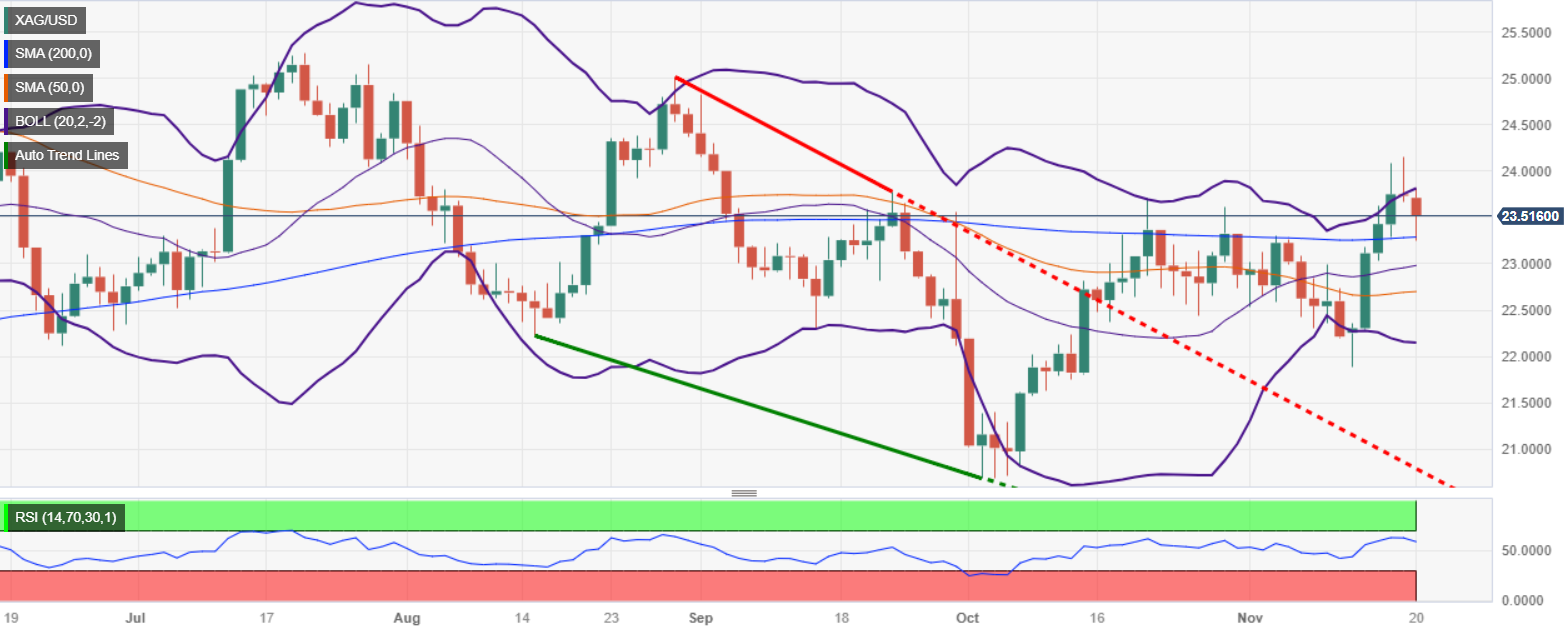
Silver Technical Levels
Source: Fx Street
I am Joshua Winder, a senior-level journalist and editor at World Stock Market. I specialize in covering news related to the stock market and economic trends. With more than 8 years of experience in this field, I have become an expert in financial reporting.


