
- Silver has bounced from daily lows near $23.00 and is rising strongly, gaining 1.33%.
- The US dollar continued to weaken, but Treasury yields held back the XAG/USD rally.
- XAG/USD is exposed to selling pressure below $23.60; otherwise, it could retest the year-over-year high.
Silver price is paring some of Wednesday’s losses and tests the 20-day EMA around $23.65 in a trading session characterized by a weaker US dollar (USD) and bearish mood Spurred by recession fears after disappointing US data. Therefore, XAG/USD is trading at $23.74 after hitting a daily low of $23.17.
Silver Price Analysis: XAG/USD Technical Outlook
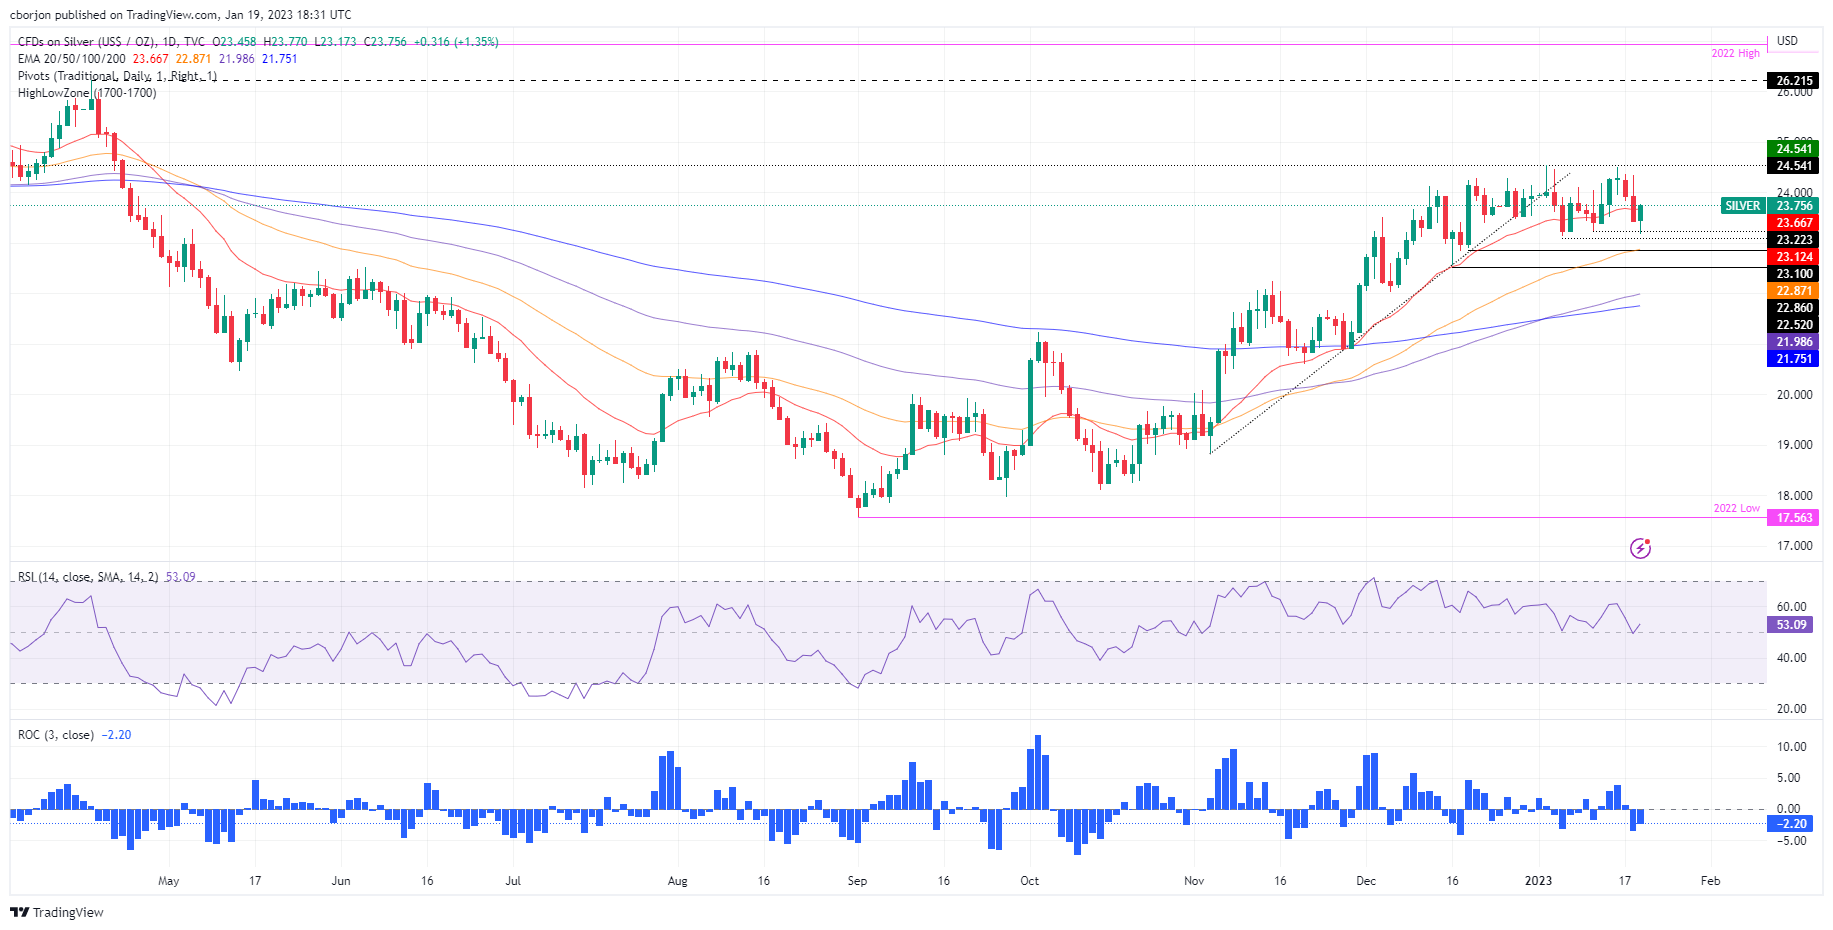
The daily chart for Silver suggests that the white metal could top around the $24.50 area. Non-yielding metal has not been able to break the latter, keeping Silver bears hopeful. While XAG/USD has made higher highs, the Relative Strength Index (RSI) has not, opening the door for negative divergence. In addition, the Rate of Change (TCC) of the last two days suggests an increase in bearish momentum. Therefore, a Pullback in XAG/USD is on the cards.
For this scenario to play out, XAG/USD needs to break below $23.17, so the psychological level of $23.00 could be exposed. A break of the latter would open the door to testing the 50-day EMA at $22.87, which, once broken, would send XAG/USD falling towards the December 16 low of $22.56.
As an alternative scenario, if Silver recovers and achieves a daily close above the 20-day EMA, that could pave the way for a retest of the yearly high of $24.54. Firstly, a recovery from the former would expose the $24.00 area. A break above will reveal the yearly high at $24.54.
Silver Key Technical Levels
Source: Fx Street
I am Joshua Winder, a senior-level journalist and editor at World Stock Market. I specialize in covering news related to the stock market and economic trends. With more than 8 years of experience in this field, I have become an expert in financial reporting.


