
- The price of Silver attracts some buyers for the fifth day in a row on Friday.
- The previous day’s breakout of the $23.60-$23.70 zone favors the bulls.
- Corrective declines are likely to be bought and remain limited.
The price of Silver (XAG/USD) gains ground for the fifth consecutive day on Friday and remains near its highest level since September 4 touched the previous day. The white metal is currently trading just below the $24.00 level and looks set to take advantage of this week’s solid rebound from a four-week low.
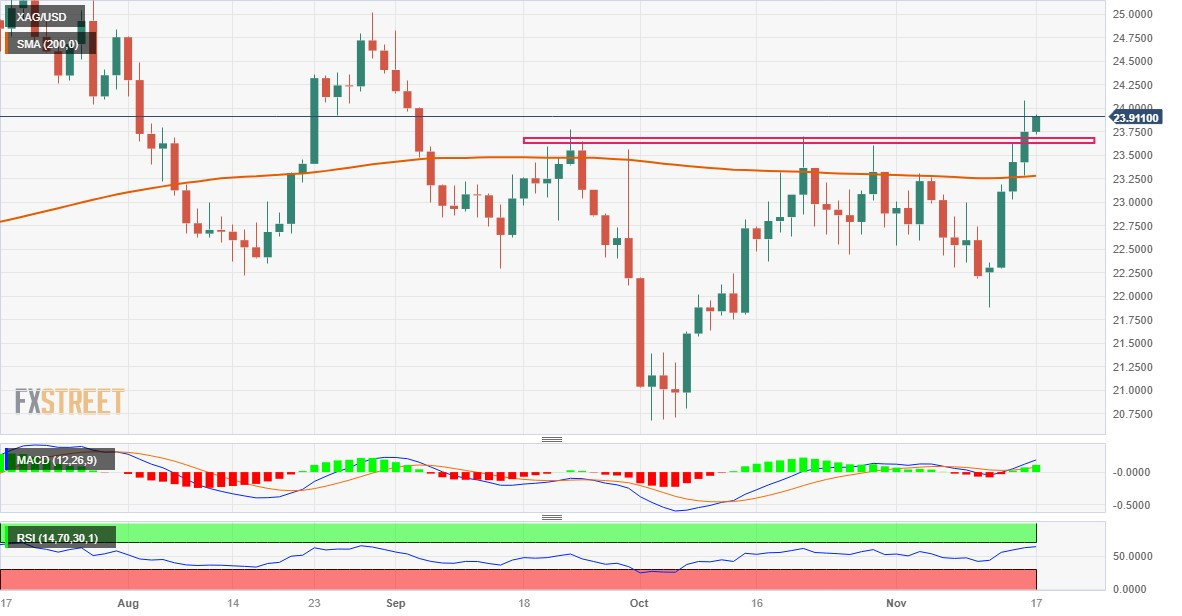
Technically, the acceptance above the all-important 200-day SMA and the previous day’s breakout of the $23.60 to $23.70 resistance zone were seen as a new trigger for the bulls. Furthermore, the oscillators on the daily chart have been gaining positive traction and validate the positive near-term outlook, suggesting that the path of least resistance for XAG/USD is to the upside.
Continuation buying above the $24.00 round level will reaffirm the constructive setup and take the white metal to the intermediate resistance of $24.20-$24.25. The momentum could extend and allow XAG/USD to make a new attempt to conquer the psychological level of $25.00. That being said, the price of Silver remains on track to post strong weekly gains and post its highest weekly close since late August.
On the other hand, the breakpoint of the strong resistance at $23.70 to $23.60 seems to protect the immediate decline ahead of the 200-day SMA, currently near the $23.30 region. Any further decline could attract new buyers and remain capped near the round $23.00 level. The latter should act as a key point, which if broken could drag XAG/USD to the $22.35-$22.30 zone on the way to the $22.00 level.
A convincing break below this last level could change the short-term trend in favor of the bears. If XAG/USD continues to sell below the $21.85 area, the monthly low, it could accelerate the decline towards the $21.35-$21.30 area. The white metal could weaken further below the $21.00 level and test a multi-month low around the $20.70-$20.65 area touched in October.
Daily Silver Price Chart
Silver additional technical levels
Source: Fx Street
I am Joshua Winder, a senior-level journalist and editor at World Stock Market. I specialize in covering news related to the stock market and economic trends. With more than 8 years of experience in this field, I have become an expert in financial reporting.


