
- USD/CHF remains below the psychological barrier of 0.8900.
- Technical indicators suggest weaker momentum for the pair.
- A break above the nine-day EMA could help the pair reach the 38.2% Fibonacci retracement.
USD/CHF appears to retrace recent gains, trading around 0.8880 during the European session on Friday. The pair could find immediate support around the important 0.8850 level, aligned with the monthly low at 0.8854.
A decisive break below the level could push the USD/CHF pair towards the psychological level at 0.8800 with conjunction at the September low at 0.8795.
The ongoing bearish trend is supported by the technical indicators of the USD/CHF pair. The 14-day Relative Strength Index (RSI) below the 50 level signals downward pressure, signaling weaker momentum for the pair.
Furthermore, the Moving Average Convergence Divergence (MACD) line below the center line, with divergence below the signal line, suggests bearish momentum in the USD/CHF pair.
On the bullish side, the psychological level of 0.8900 emerges as the immediate resistance followed by the nine-day Exponential Moving Average (EMA) at 0.8939 aligned with the 23.6% Fibonacci retracement at 0.8947.
A firm break above this latest level could support USD/CHF bulls to approach the region around the 38.2% Fibonacci retracement at 0.9004.
USD/CHF: Daily Chart
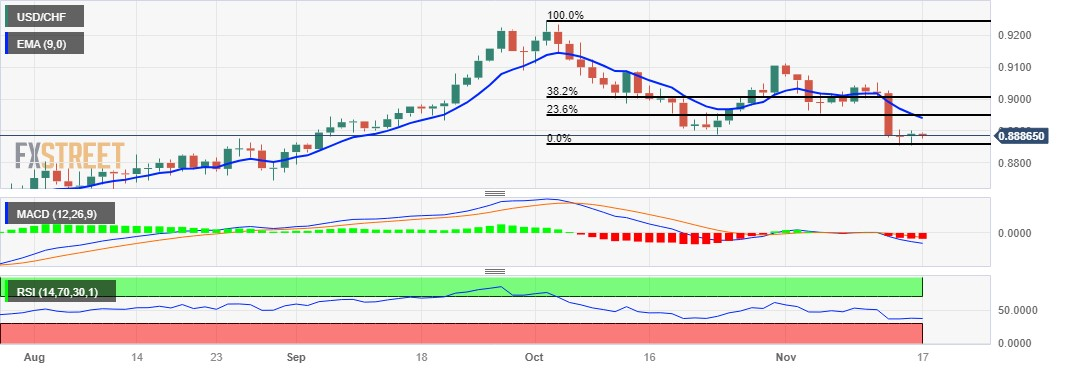
Source: Fx Street
I am Joshua Winder, a senior-level journalist and editor at World Stock Market. I specialize in covering news related to the stock market and economic trends. With more than 8 years of experience in this field, I have become an expert in financial reporting.


