
- Silver price hits a two-week high of $28.80, while the US dollar falls.
- The US dollar falls even though the US PPI grew at a faster pace in April.
- The Fed could delay rate cuts beyond September.
The price of Silver (XAG/USD) rises to $28.60 in the American session on Tuesday. The white metal strengthens while the US dollar falls even though the US Bureau of Labor Statistics (BLS) has published the Producer Price Index (PPI) report.
The monthly headline PPI grew at a faster pace of 0.5% versus estimates of 0.3%, suggesting price pressures remained persistent early in the second quarter. The core PPI, which excludes food and energy price volatility, also rose 0.5%. Annual headline and core PPI data grew in line with estimates of 2.2% and 2.4%.
This has heightened fears that the Federal Reserve (Fed) will delay rate cuts beyond September or keep interest rates at their current range of 5.25%-5.50% for the full year. The US Dollar Index (DXY), which tracks the value of the Dollar against six major currencies, falls to 105.00. The attractiveness of dollar-denominated Silver improves when the Dollar depreciates.
The 10-year US Treasury yield continues to fall to 4.46%. Typically, increasing risks of persistent inflation drive returns on low-interest-rate assets. However, in this case, bond yields have fallen. This has decreased the opportunity cost of maintaining an investment in non-yielding assets, such as Silver.
This week, the US Consumer Price Index (CPI) data for April will be the main economic indicator that will help investors project the next movement of the price of Silver, the US Dollar and bond yields, which will be will publish on Wednesday. Investors will also focus on monthly retail sales, which will be released alongside consumer inflation data.
Silver technical analysis
Silver price recovers sharply after discovering buying interest near the horizontal support drawn from the April 14, 2023 high around $26.09 on a daily time frame. The aforementioned support was a major resistance for the Silver price bulls. The white metal is approaching a multi-year high at $29.80.
Silver's short-term outlook has improved as it returns above the 20-period EMA, which is trading around $27.30.
The 14-period RSI is moving within the bullish range of 60.00-80.00, suggesting that bullish momentum has been triggered.
Silver Daily Chart
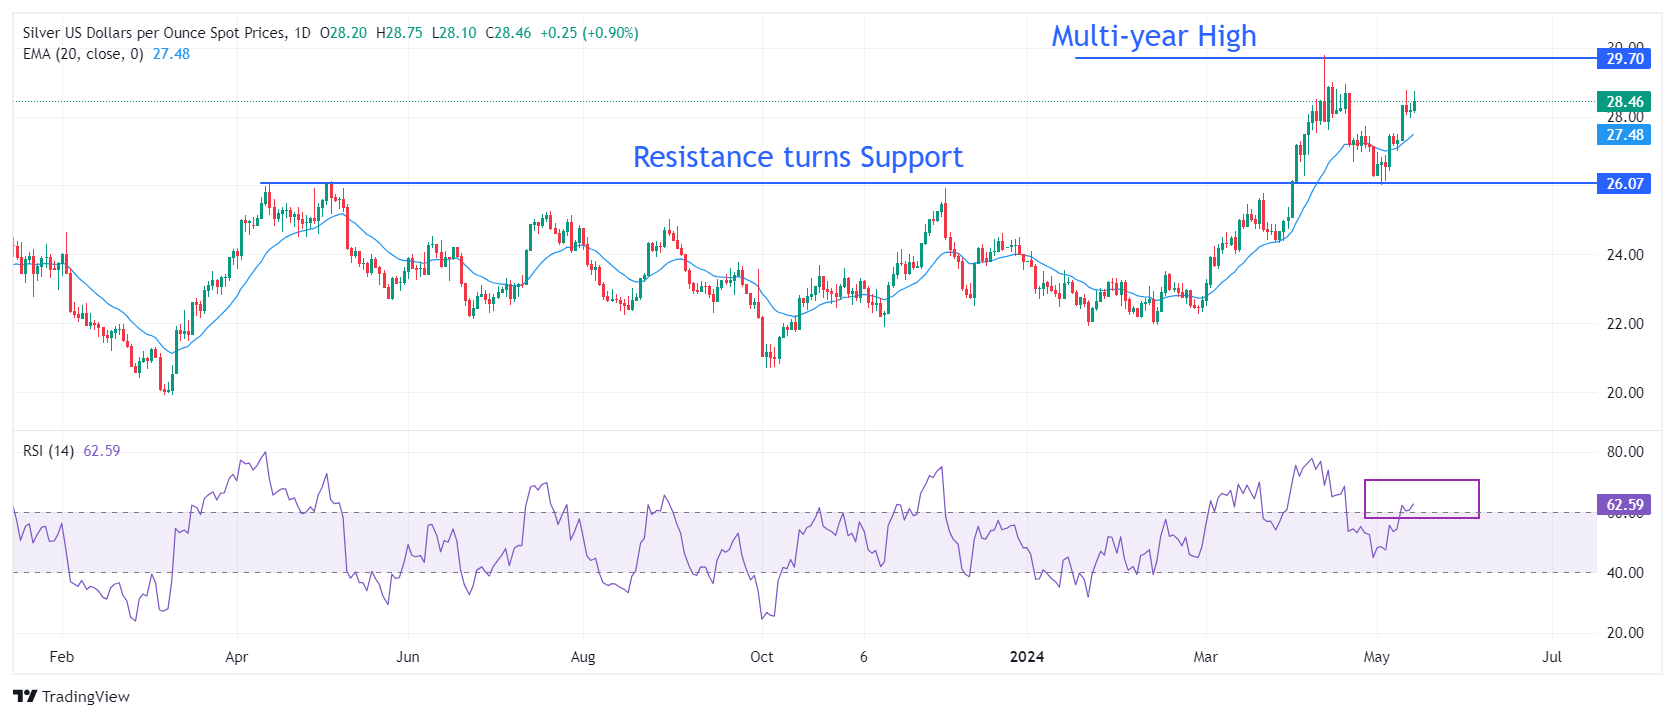
Source: Fx Street
I am Joshua Winder, a senior-level journalist and editor at World Stock Market. I specialize in covering news related to the stock market and economic trends. With more than 8 years of experience in this field, I have become an expert in financial reporting.


