
- The price of silver moves lower on Tuesday, although there is no follow-up selling at the moment.
- The setup continues to favor the bulls and supports further earnings prospects.
- A break below the $23.40-35 confluence could undo the uptrend.
The silver price (XAG/USD) is moving lower during the European session on Tuesday, although it has had no continuation and remains within the wider operating range of the previous day. The white metal manages to hold above the $24.00 level, and looks set to continue to rally.
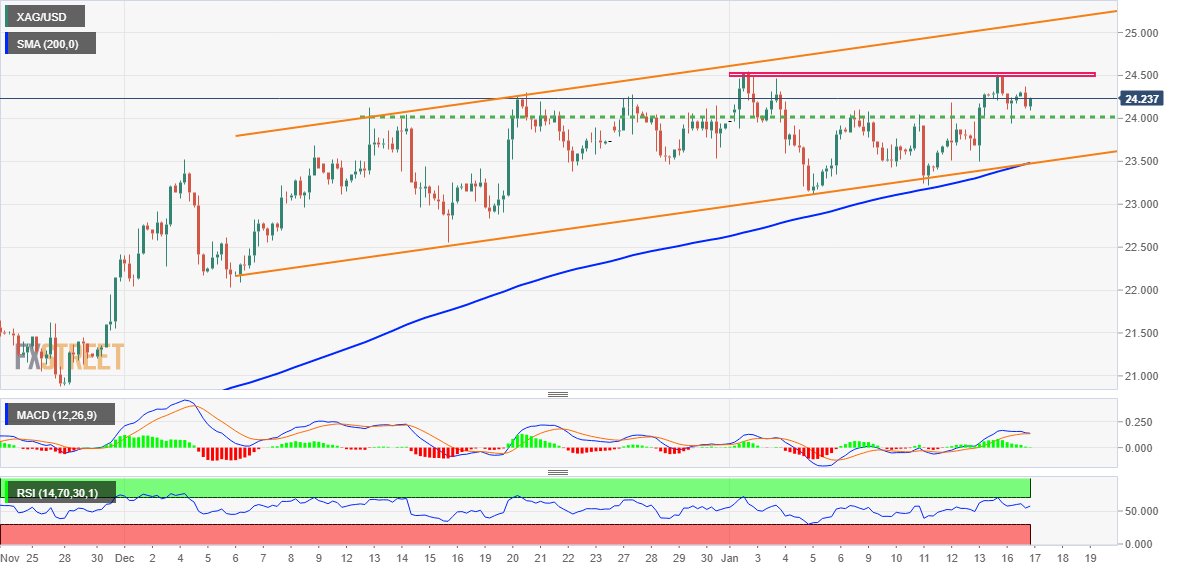
The recent price movement in the last month constitutes the formation of an ascending channel. The lower end of that trend channel, currently around the $23.40-$23.35 zone, coincides with the 200 SMA on the 4-hour chart and should act as a pivotal point for XAG/USD.
The oscillators on the 4 hour/daily chart, although they have been losing traction, remain in positive territory and favor the bulls. That being said, it will be prudent to wait for some continuation buying above the multi-month high around the $24.50 area before positioning for further gains.
The subsequent move higher could send XAG/USD towards the psychological level of $25.00 for the first time since April 2022. Some continuation buying should pave the way for an extension of the move higher towards the next relevant hurdle near the zone of resistance at $25.35-$25.40.
On the other hand, any significant drop below the $24.00 level is likely to attract new buyers and remain capped near the aforementioned confluence support around the $23.40-$23.35 area. A convincing break below this region will nullify the positive outlook and shift the bias in favor of the bears.
XAG/USD could weaken below the $23.00 level and accelerate the decline towards the $22.60-$22.55 zone. The bearish trajectory could extend further towards the next relevant support near the $22.10-$22.00 zone.
Silver 4 hour chart
Silver additional technical levels
Source: Fx Street
I am Joshua Winder, a senior-level journalist and editor at World Stock Market. I specialize in covering news related to the stock market and economic trends. With more than 8 years of experience in this field, I have become an expert in financial reporting.


