
- Silver is trading at $29.60, posting slight losses of 0.04% amid mixed US economic data.
- The technical picture shows a 'doji' pattern, signaling indecision among traders.
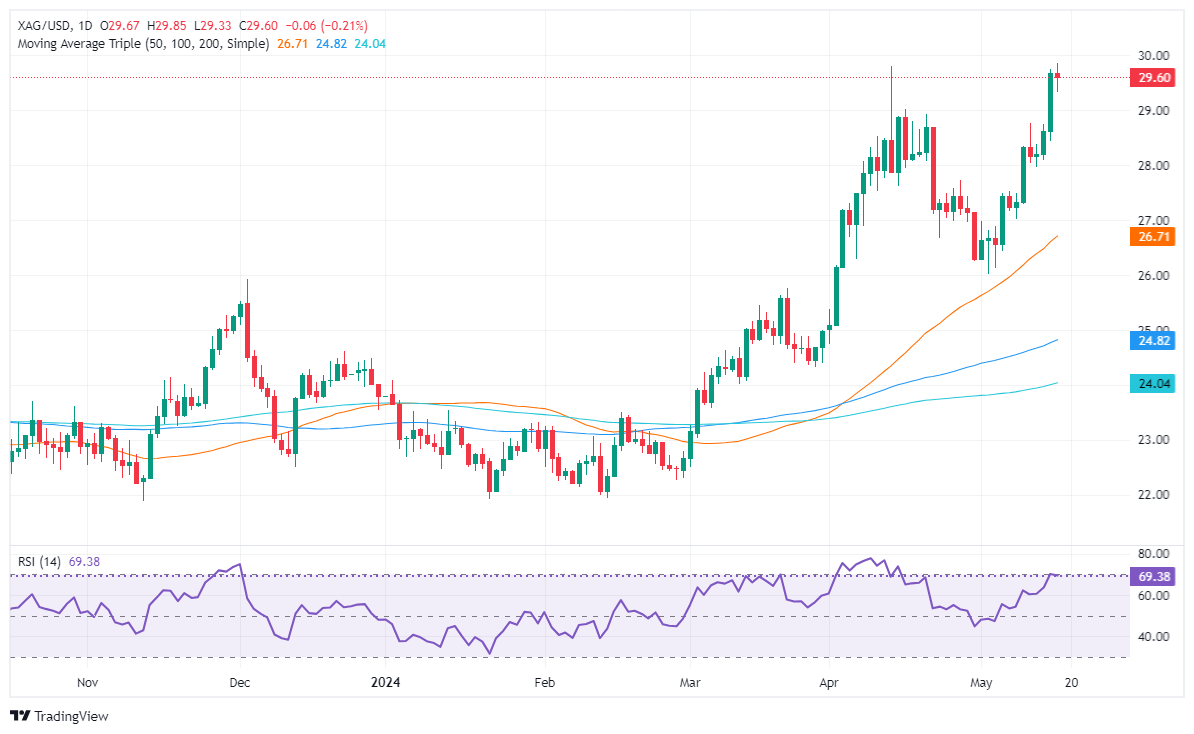
- Silver must hold above $29.00 to challenge the year-to-date high of $29.79 and additional resistance levels at $32.15 and $35.40.
Silver's advance paused on Thursday, as the gray metal posted minuscule losses of 0.04%, trading virtually unchanged. The employment data, along with mixed housing data and lack of strength in the manufacturing and industrial sectors, boosted US and Dollar returns. Therefore, the gray metal fell and was trading at $29.60 at the time of writing.
XAG/USD Price Analysis: Technical Overview
Silver's bullish trend is still in place, but Thursday's price action forming a 'doji' indicates that neither buyers nor sellers are in control of the price action. It must be said that a 'double top' is coming. However, the momentum favors the former, as the RSI continues to point upwards despite approaching overbought conditions.
That said, if XAG/USD holds above $29.00, buyers could remain hopeful of testing the year-to-date high of $29.79. A breakout of the latter will pave the way to challenge the February 2013 high of $32.15, followed by the October 2012 high of $35.40.
On the contrary, sellers must drag the price of Silver below $29.00. In that outcome, the pullback could reach the May 18, 2021 high turned support at $28.75, followed by the $28.00 mark. Further losses lie below the latter, with key support seen at $27.00.
XAG/USD Price Action – Daily Chart
Source: Fx Street
I am Joshua Winder, a senior-level journalist and editor at World Stock Market. I specialize in covering news related to the stock market and economic trends. With more than 8 years of experience in this field, I have become an expert in financial reporting.


