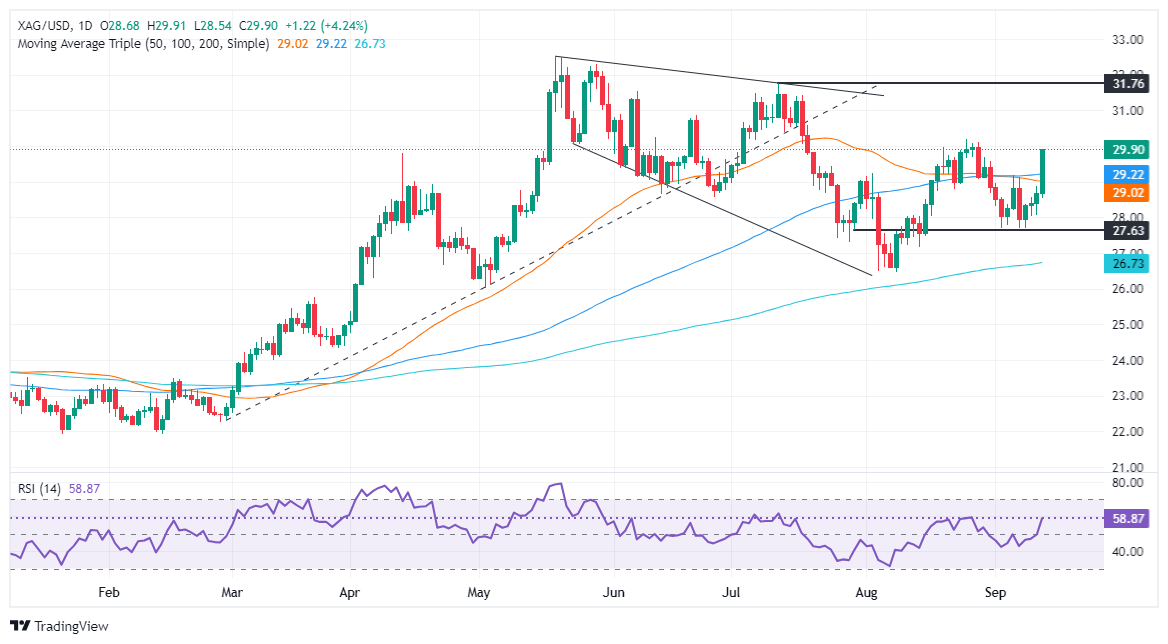
- Silver breaks above the 50-day moving average (DMA) at $28.99 and the 100-day moving average (DMA) at $29.20, supported by a bullish ‘double bottom’ formation.
- The RSI signals strong momentum, with first resistance at $30.00, followed by targets at $30.18 and $30.84.
- A drop below $29.00 could signal a bearish reversal, with key support at this level.
Silver prices rose sharply on Thursday and gained over 4.30% during the day, trading at $29.90 after bouncing from daily lows of $28.54. The grey metal rose due to the overall weakness of the US Dollar, despite inflation rising slightly. However, a poor employment report boosted silver’s rise.
XAG/USD Price Forecast: Technical Outlook
From a technical standpoint, a ‘double bottom’ formation supported the underperforming advance, clearing key resistance at the 50-day moving average (DMA) at $28.99 and the 100-day moving average (DMA) at $29.20 on its way north.
Momentum is bullish as shown by the Relative Strength Index (RSI). Therefore, the path of least resistance for XAG/USD is tilted to the upside.
Silver’s first resistance would be $30.00. A break of the latter would expose the August 26 high at $30.18, followed by the June 21 peak at $30.84. If overcome, the next stop would be the July 11 high at $31.75.
If the bears want to regain control, they need to push prices below the $29.00 figure.
XAG/USD Price Action – Daily Chart
Source: Fx Street
I am Joshua Winder, a senior-level journalist and editor at World Stock Market. I specialize in covering news related to the stock market and economic trends. With more than 8 years of experience in this field, I have become an expert in financial reporting.


