
- Silver falls after hitting a new yearly high at $24.62 and returns below $23.50.
- Gold Price Forecast: XAU/USD erases Wednesday’s gains and falls below $1,920 after BOE and ECB decisions.
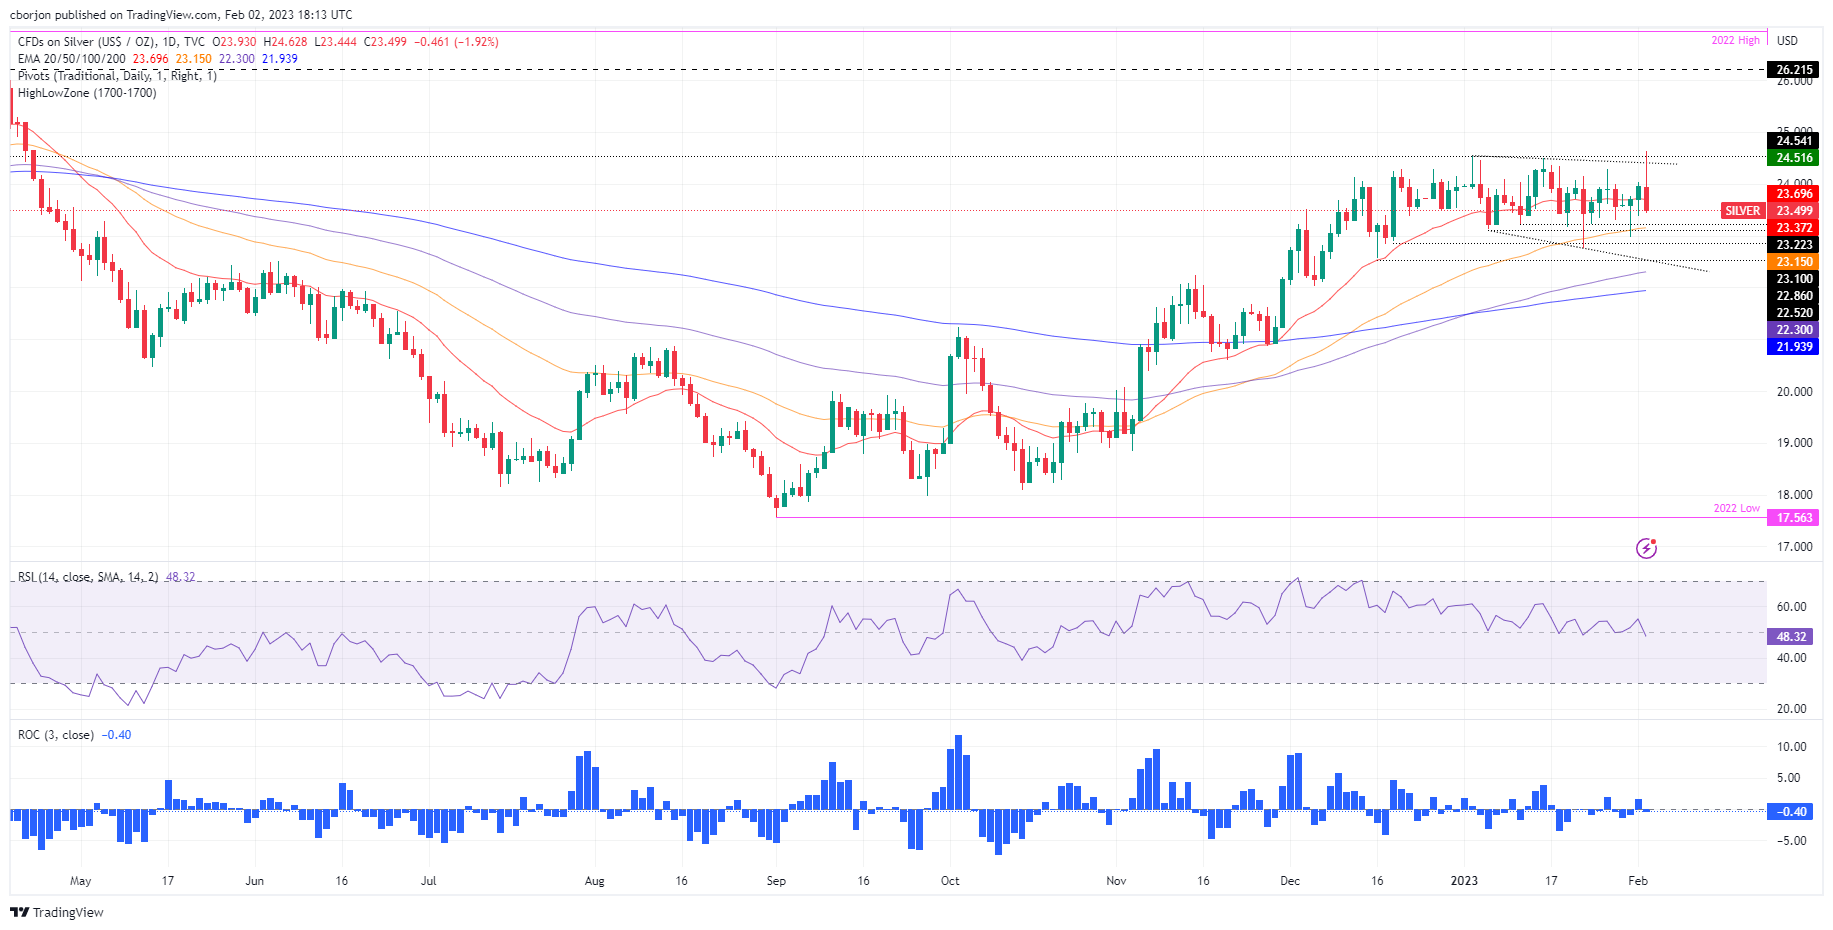
- Silver Price Analysis: Trapped in the $23.00-$24.50 range.
After hitting a fresh nine-month high of $24.62, Silver price plummeted, failing to break out of the $23.00-$24.50 range for a fourth straight day of the week, trading around $23.40 in the time of writing these lines.
Wall Street continues to post gains bolstered by a big tech company projecting a positive outlook for 2023. The Federal Reserve’s 25 basis point rate hike weighed on the dollar during overnight trading on Wednesday and Thursday. However, the dollar is rallying, despite falling US Treasury yields. That has been a tailwind for the white metal, which has extended its losses towards the bottom of the range.
Silver Price Analysis: XAG/USD Technical Outlook
XAG/USD is still range bound, dipping below the 20-day EMA at $23.69, which would act as a resistance level should Silver attempt a rally to $24.00. The failure of XAG/USD to break above the $24.54 high could pave the way for a retest of $23.00, a psychological level. Once broken, the January 23 swing low at $22.76 would come into play, followed by the December 16 daily low at $22.56.
As an alternative scenario, the recovery of Silver from $24.00 would open the door to further rises and a continuation after a month of consolidation, within the range of $23.00-$24.50. After XAG/USD breaks above the top of the range, the next top would be the yearly high at $24.62, followed by $25.00.
Silver Key Technical Levels
Source: Fx Street
I am Joshua Winder, a senior-level journalist and editor at World Stock Market. I specialize in covering news related to the stock market and economic trends. With more than 8 years of experience in this field, I have become an expert in financial reporting.


