
- S&P 500 halts its decline from the highest levels since August last year and finds support in the 4,170 region.
- Sentiment has improved slightly after the approval in the House of Representatives of the bill to suspend the debt limit. The validation of the Senate is missing.
- Focus will be on data from the ADP report and Thursday’s ISM Manufacturing PMI, ahead of Friday’s NFP.
The index S&P 500 found support in the region of 4,170 points the previous day and moves slightly higher during the European session on Thursday. At time of writing, the index is trading at 4,192 points, up 0.30% on the day.
Market sentiment has slightly improved after approval in the United States House of Representatives (USA), late on Wednesday, of the bill to suspend the debt limit until January 1, 2025.
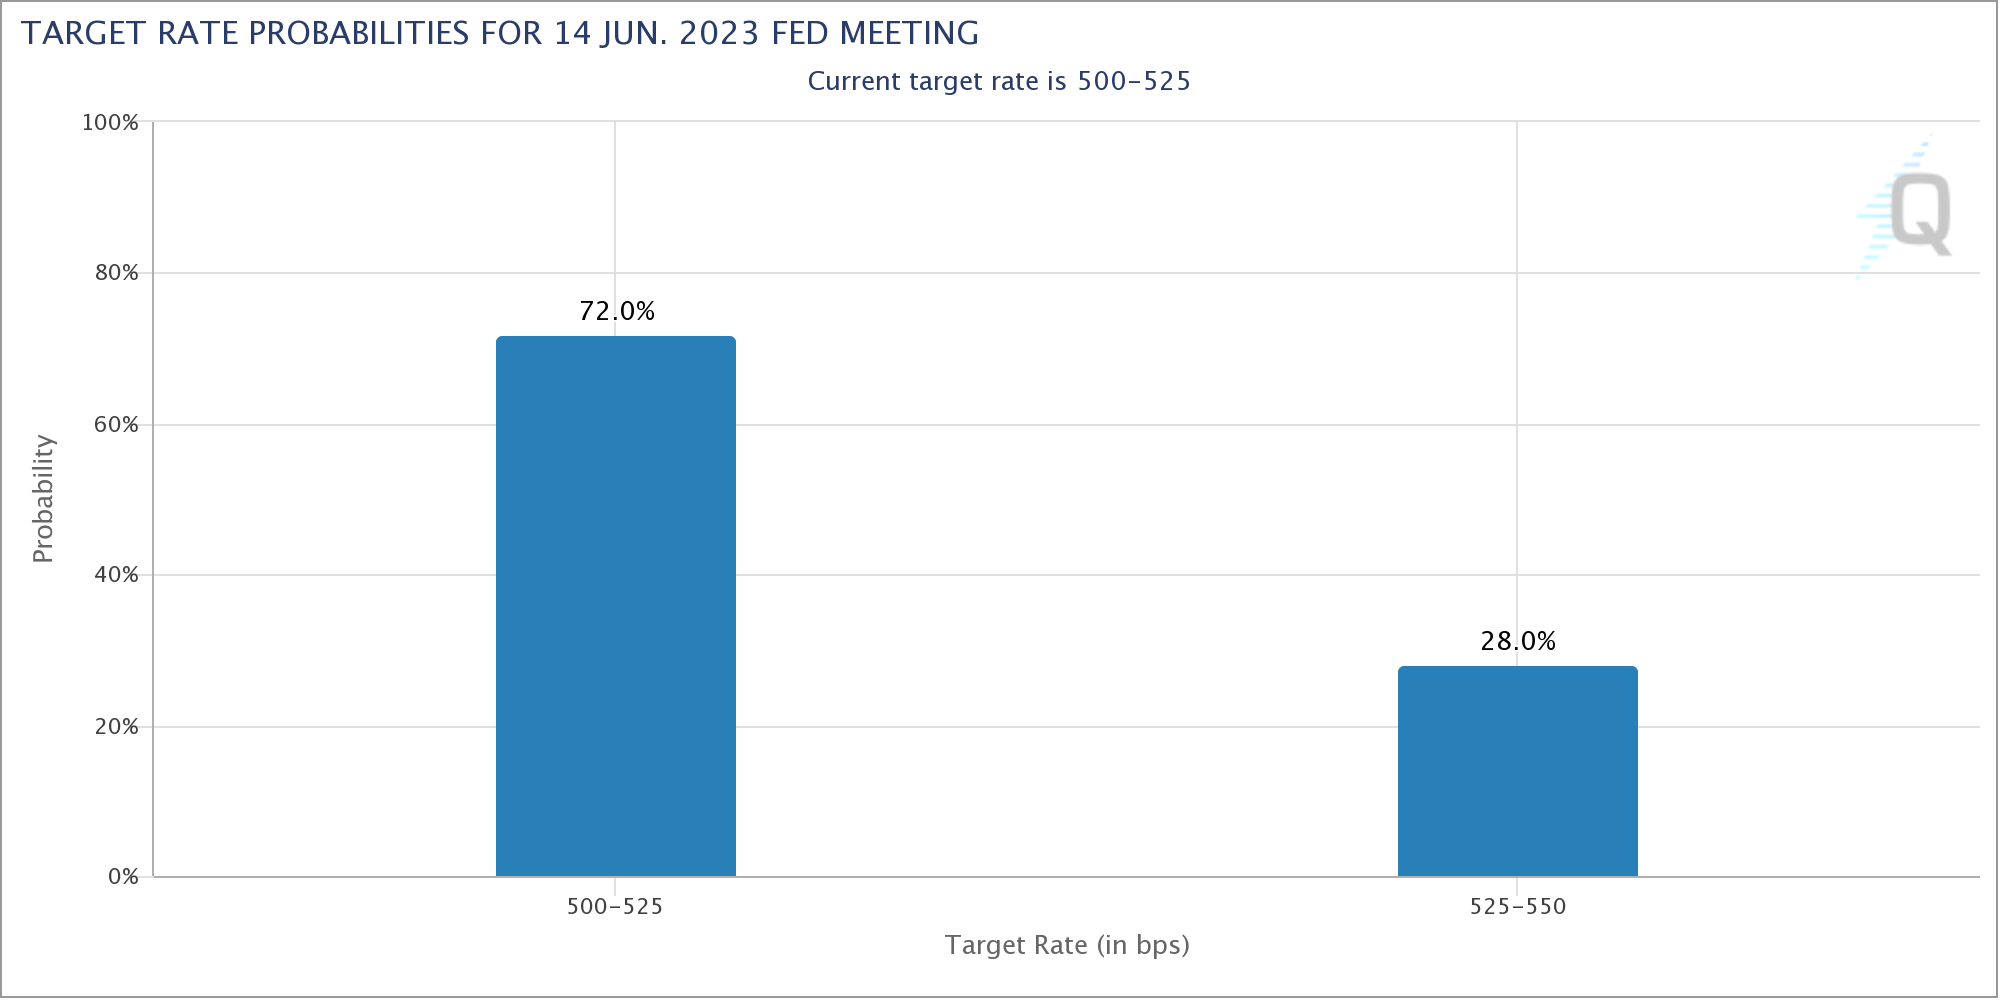
Besides, several US Federal Reserve (Fed) officials have been more cautious on new rate hikes, sharply lowering market expectations for the next meeting on June 13-14.
Today’s focus will be on ADP private sector employment data and the official ISM manufacturing Purchasing Managers’ Index (PMI) data, before focus shifts to NFP Non-Farm Payrolls data. of Friday.
S&P 500: Suspension of debt limit approved by the House, the deal should be approved by the Senate before June 5
Market sentiment has been slightly buoyed by the progress made in avoiding a US debt default. In fact, the US House of Representatives voted in favor of a bill to suspend the debt ceiling late Wednesday and the deal now heads to the Senate for approval.
“The House of Representatives, controlled by the Republicans, voted 314-117 to send the legislation to the Senate, which must enact the measure and get it to President Joe Biden’s desk by a Monday deadlinewhen the federal government is expected to run out of money to pay its bills,” Reuters said.
S&P 500: Does US data support further Fed rate hikes?
As sentiment improves on the US House of Representatives passing the debt limit deal, investors’ attention turns back to this week’s top US data and its implications. on the US Fed’s rate hikes.
Last week it was reported that US annualized Gross Domestic Product (GDP) was revised up up to 1.3% for the first quarter of 2023, while the core Personal Consumption Expenditure (PCE) price index, the inflation indicator preferred by the Federal Reserve, rose to 4.7% from 4.6% previously.
Better growth data, coupled with stubbornly high inflation, forced market participants to assess the possibility of another 25 basis point rise in June up to the range of 5.25%-5.50%.
Subsequent comments from Fed members appeared to support a rate hike. On Tuesday, the President of the Federal Reserve Bank of Cleveland, Loretta Mester made hawkish comments, suggesting the Fed should bet on a June rate hikesaying that: “I really don’t see a compelling reason to pause, that is, to wait for more evidence to decide what to do.”
On Wednesday, the JOLTs survey of job openings and job turnover showed that the number of job vacancies on the last business day of April stood at 10.1 million, compared to 9.74 million in March. This data showed new positive clues about the US labor market.
Later on Wednesday, a pair of influential FOMC members expressed their willingness to pause interest rate hikes this month. In fact, the governor of the Federal Reserve (Fed), Philip Jefferson, said a pause on rate hikes at the next FOMC meeting would give time to analyze more data before making a decision on the scope of further tightening. For his part, the president of the Philadelphia Fed, Patrick Harker, was in favor of a pause in the next meeting.
Besides, Nick Timiraosfrom the Wall Street Journal (WSJ), cited several Fed speakers and recently disparate US data to suggest that the Federal Open Market Committee (FOMC) is likely to keep interest rates stable in June.
After these moderate comments, the probability of a new 0.25% rate hike in June fell sharply to 28%from the previous 65%:
Later today, market participants will follow the US economic agenda, with the ADP report on private sector employment, the usual weekly initial jobless claims and the manufacturing Purchasing Managers’ Index (PMI). ISM official.
The jobs report is expected to ADP shows an increase of 170,000 new jobs in the private sector from the US in May, up from 296,000 views the previous month.
On the other hand, it is expected that weekly claims for unemployment benefits increase to 235,000 in the week ending May 26, up slightly from 229,000 views the week before.
Finally, it is expected that ISM manufacturing PMI falls to 47 points in May from the previous 47.1. In addition, the manufacturing employment index is expected to fall to 49.8 points, the new orders index to fall to 44.9, and the prices paid index to fall to 52 points.
S&P 500 Technical Analysis
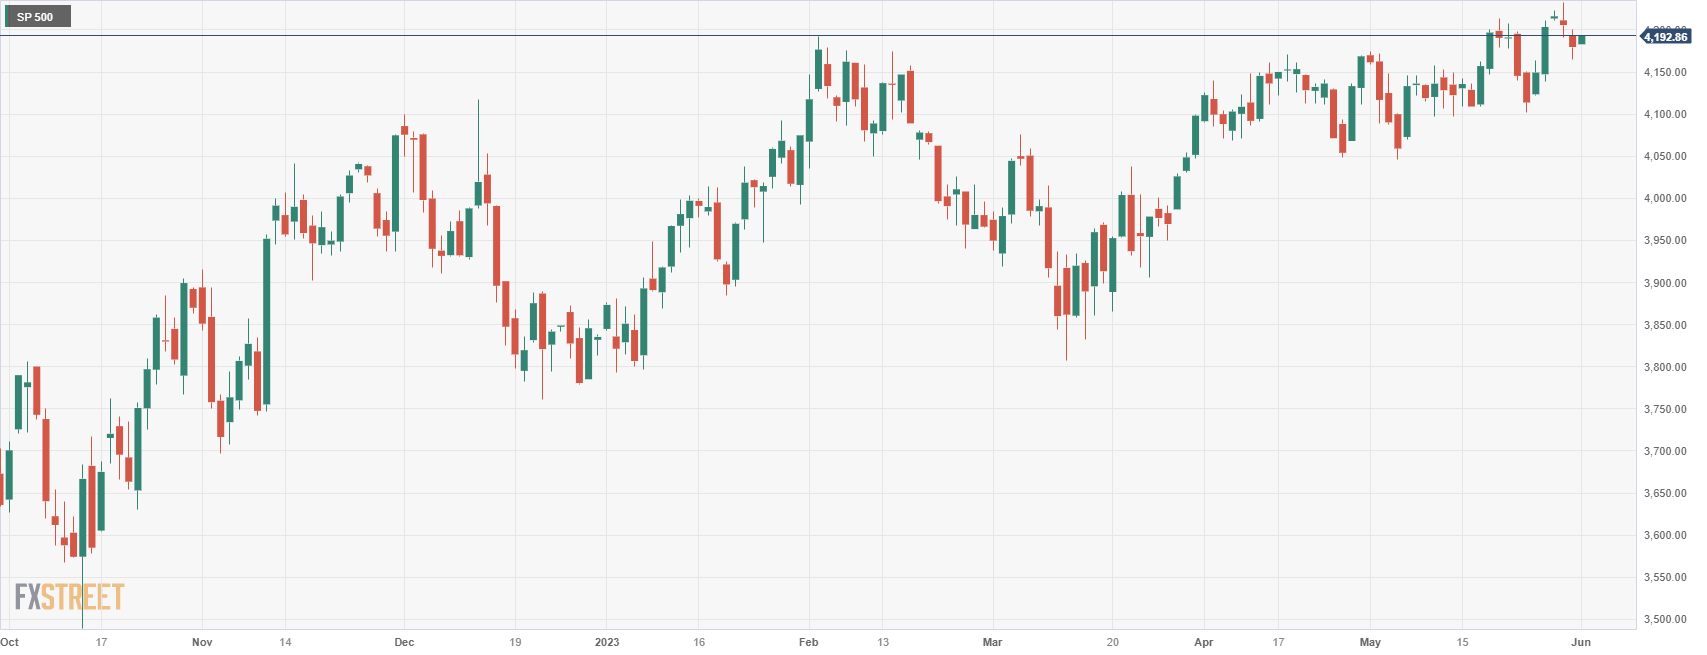
Technically, the S&P 500 has stopped its retracement slide from the highest levels since August of last year at 4,233, finding support in the 4,170 region points the day before.
At the time of writing, the S&P 500 is trading at 4,190 and remains just above initial support in the region of 4.170-4.175. Further down, the index could find the next support in the area of 4,150. If that level is broken decisively, the S&P 500 could test key near-term support in the area of recent lows around the US$ level. 4,100 points.
On the other hand, the S&P 500 is initially limited by the level of the 4,200 points. A break above that level could point to yearly highs in 4,233where it closed a bearish opening gap from August 19-22, 2022. Higher up there is no resistance until the 4,250 points and the region of 4,310-4,320zone of maximums of August of last year.
S&P 500 daily chart
S&P 500 FAQ
What is the S&P 500?
The S&P 500 is a widely followed stock index that measures the performance of 500 public companies and is considered a broad measure of the US stock market. The influence of each company in the index calculation is weighted based on market capitalization. This is calculated by multiplying the number of listed shares of the company by the share price. The S&P 500 Index has achieved impressive returns: $1.00 invested in 1970 would have produced a return of almost $192.00 in 2022. The average annual return since its inception in 1957 has been 11.9%.
How are companies chosen to be included in the S&P 500?
Companies are selected by committee, unlike other indices where they are included based on established standards. Still, they must meet certain eligibility criteria, the most important of which is market capitalization, which must be equal to or greater than $12.7 billion. Other criteria are liquidity, domicile, market capitalization, industry, financial viability, time listed, and representation of sectors of the US economy. The nine largest companies in the index represent 27.8% of the index’s market capitalization.
How can I trade the S&P 500?
There are several ways to trade the S&P 500. Most retail brokers and spread betting platforms allow traders to use Contracts for Difference (CFDs) to place bets on the direction of the price. In addition, you can buy index funds, mutual funds, and exchange-traded funds (ETFs) that track the price of the S&P 500. The most liquid of the ETFs is the London Stock Exchange ETF. The most liquid of the ETFs is the State Street Corporation SPY. The Chicago Mercantile Exchange (CME) offers futures contracts on the index and the Chicago Board of Options (CMOE) offers options, as well as ETFs, Reverse ETFs, and Leveraged ETFs.
What factors drive the S&P 500?
Many factors drive the S&P 500, but it’s primarily the aggregate performance of its component companies, revealed in their quarterly and annual earnings reports. US and global macroeconomic data also contributes as it influences investor confidence, which if positive boosts earnings. The level of interest rates, set by the Federal Reserve (Fed), also influences the S&P 500, as it affects the cost of credit, on which many companies are highly dependent. Therefore, inflation can be a determining factor, as well as other parameters that influence the decisions of the Federal Reserve.
Source: Fx Street
I am Joshua Winder, a senior-level journalist and editor at World Stock Market. I specialize in covering news related to the stock market and economic trends. With more than 8 years of experience in this field, I have become an expert in financial reporting.


