
- The S&P 500 stock index gains 1.01% today, reaching almost two-week highs.
- United States Industrial Production increased 0.9% in December, exceeding analysts’ forecasts.
- Investors’ attention will be on the executive orders that will be issued as soon as Donald Trump takes office.
The S&P 500 set a day’s low at 5,937, drawing aggressive buyers who pushed the index to nearly two-week highs at 6,011. Currently, the S&P 500 is trading at 5.995, gaining 1.01% on the day.
Investors’ focus will be on Donald Trump’s executive orders
The United States reported a growth of 0.9% in its Industrial Production corresponding to December, exceeding the 0.3% projected by analysts and the 0.2% previously recorded. Likewise, construction permits increased to 1,483 million in December, exceeding the 1.46 million expected by the market.
Markets will take a pause on Monday in observance of Martin Luther King Day, however, investors will be attentive to the set of executive orders on tax and tariff matters by Donald Trump, as he takes office as the 47th president of USA.
In this context, the S&P 500 registers a weekly gain of 2.95%, reaching maximums not seen since January 6 at 6,011.
Levels to consider in the S&P 500
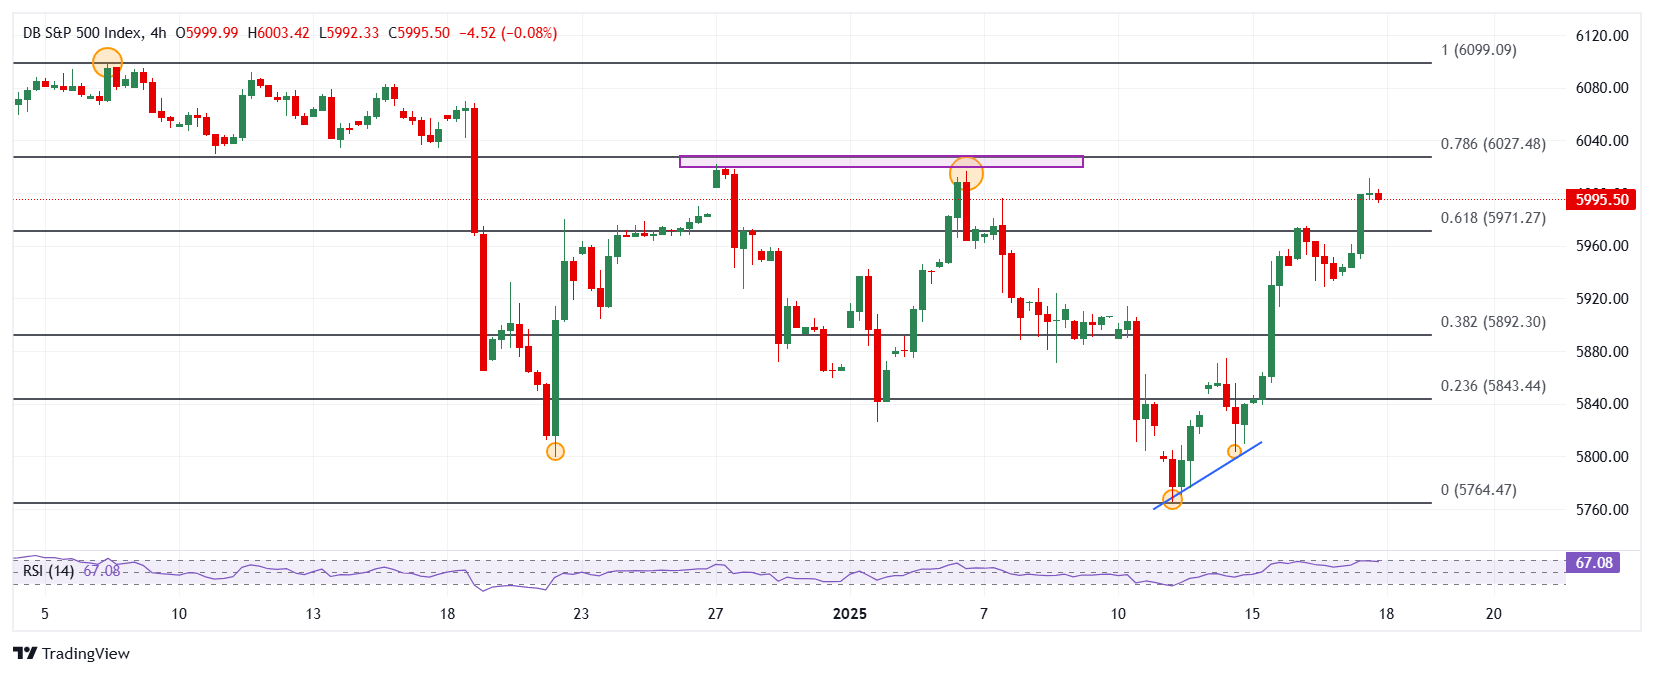
The S&P 500 established short-term support at 5,803, given by the January 14 low. We see the next key support zone at 5,765, the pivot point of January 13. We observe the closest resistance at 6,017, the maximum of January 6.
S&P 500 4-hour chart
S&P 500 FAQs
The S&P 500 is a widely followed stock index that measures the performance of 500 public companies and is considered a broad measure of the US stock market. The influence of each company in the calculation of the index is weighted based on market capitalization. This is calculated by multiplying the number of listed shares of the company by the share price. The S&P 500 Index has achieved impressive returns: $1.00 invested in 1970 would have produced a return of almost $192.00 in 2022. The average annual return since its inception in 1957 has been 11.9%.
Companies are selected by committee, unlike other indices where they are included based on established standards. Still, they must meet certain eligibility criteria, the most important of which is market capitalization, which must be equal to or greater than $12.7 billion. Other criteria are liquidity, domicile, market capitalization, sector, financial viability, listing time, and representation of the sectors of the United States economy. The nine largest companies in the index represent 27.8% of the index’s market capitalization.
There are several ways to trade the S&P 500. Most retail brokers and spread betting platforms allow traders to use Contracts for Difference (CFDs) to place bets on price direction. In addition, you can buy index funds, mutual funds and exchange-traded funds (ETFs) that track the price of the S&P 500. The most liquid of the ETFs is the London Stock Exchange ETF. The most liquid of the ETFs is State Street Corporation’s SPY. The Chicago Mercantile Exchange (CME) offers futures contracts on the index and the Chicago Board of Options (CMOE) offers options, as well as ETFs, inverse ETFs, and leveraged ETFs.
There are many factors that drive the S&P 500, but primarily it is the aggregate performance of its component companies, revealed in their quarterly and annual earnings reports. US and global macroeconomic data also contribute, influencing investor sentiment, which if positive, drives earnings. The level of interest rates, set by the Federal Reserve (Fed), also influences the S&P 500, as it affects the cost of credit, on which many companies largely depend. Therefore, inflation can be a determining factor, as well as other parameters that influence the decisions of the Federal Reserve.
Source: Fx Street
I am Joshua Winder, a senior-level journalist and editor at World Stock Market. I specialize in covering news related to the stock market and economic trends. With more than 8 years of experience in this field, I have become an expert in financial reporting.


