- The S&P 500 gains 0.29% daily.
- Incyte Corporation (INCY) is up 11.99.00% on the day, after beating analyst projections in its earnings report.
- Cadence Design Systems (CDNS) shares soared 12.53% today, reaching highs in more than a month.
- Advanced Micro Devices (AMD) shares sink 5.89% in extended hours after presenting its quarterly report.
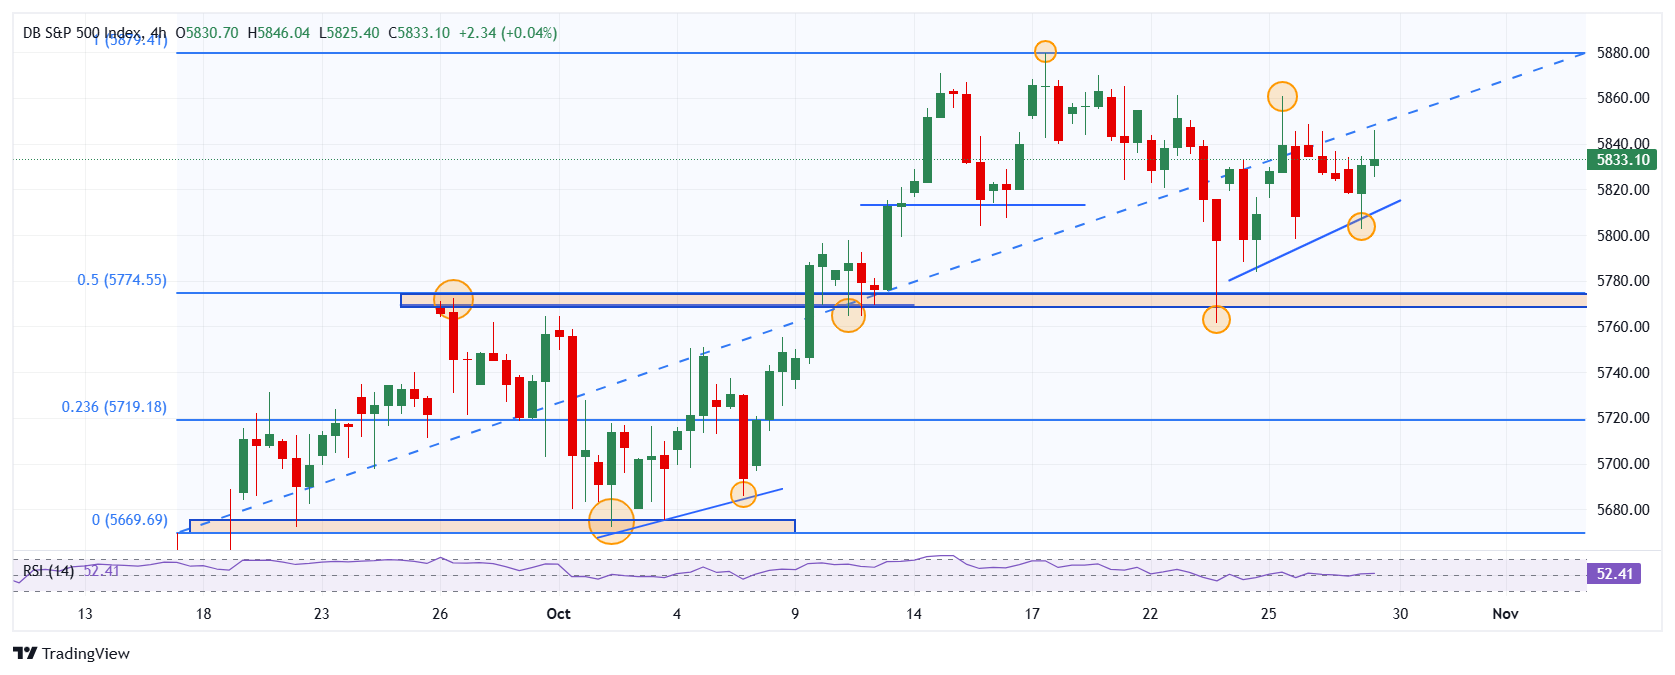
The S&P 500 set a day’s low at 5,802, where it attracted buyers who took the stock index to a daily high of 5,846. Currently, the S&P 500 is trading at 5,839, gaining 0.22% at the market close.
Cadence Design Systems and Incyte Corporation Drive Earnings in the S&P 500
The semiconductor manufacturing company Cadence Design Systems (CDNS) closes the session with a gain of 12.53%, reaching highs not seen since August 22 at $287.02. The company posted revenue of $1.22 billion, above the $1.18 billion expected by analysts, as well as earnings per share of $1.64, above the $1.44 consensus estimate.
On the other hand, Incyte Corporation (INCY), concludes the day rising 12.04% to trade at $73.60, after exceeding market forecasts by reporting revenue of $1.14 billion, above the $1.08 billion expected by the consensus. Likewise, it achieves earnings per share of $1.07, improving the estimated $1.03.
Advanced Micro Devices (AMD) shares plummet 7.09% in extended trading, trading above $154.72 as it posted revenue of $6.82 billion versus the $6.71 billion estimated by analysts. The company reported earnings per share of $0.92 in line with forecasts.
Levels to consider in the S&P 500
The S&P 500 formed short-term support, located at 5,802, today’s low that converges with a bullish trend. The next key support zone is at 5,761, the October 23 pivot point that converges with the 50% Fibonacci retracement.
To the upside, we see the closest resistance at 5,860, given by the October 25 high. The next key resistance zone is at 5,879, the all-time high reached on October 17.
S&P 500 4-hour chart

Source: Fx Street
I am Joshua Winder, a senior-level journalist and editor at World Stock Market. I specialize in covering news related to the stock market and economic trends. With more than 8 years of experience in this field, I have become an expert in financial reporting.


