
- The S&P 500 made an upward movement of more than 30 points when the United States Consumer Price Index was published.
- Monthly inflation stood at 0.3% in April, below the expected 0.4%.
The S&P 500 established an all-time high at 5,276 after the US Consumer Price Index (CPI) was released, reporting 0.3% monthly growth in April, after 0.4% in March. The data has improved expectations of 0.4%.
The market is optimistic with the economic data
Annual inflation stood at 3.4%, in line with expectations, one tenth below the 3.5% of the previous month. The core CPI, which does not consider food or energy, rose 0.3% in April after increasing 0.4% in March. It should be noted that annual core inflation decreased two tenths to 3.6% from the previous 3.8%. This is its lowest level in three years.
The market remains oscillating above 5,263, the high of March 28. Acceptance of higher levels leaves the door open for buyers to reach the next closed number 5,300. It is currently trading at 5,273 points.
Technical levels in the S&P 500
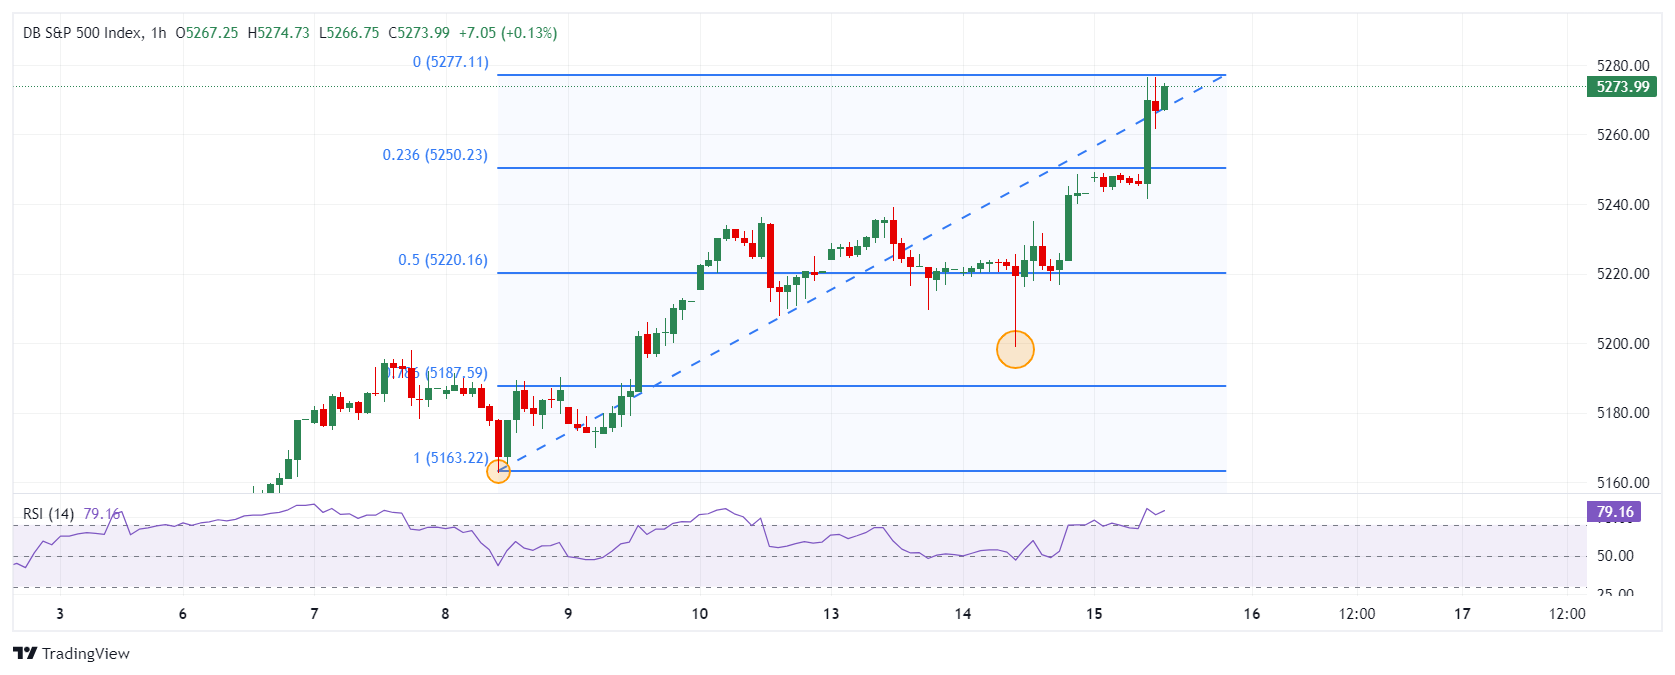
The S&P 500 established short-term support at 5,261, being the low of the American session. We have the next support at 5,240, the minimum of the European session. The nearest resistance is at 5,276, today's high. If exceeded, the next objective is the round number 5,300. The RSI reading on the 1-hour chart shows that the S&P 500 is approaching overbought levels, so we expect a pullback in the short term.
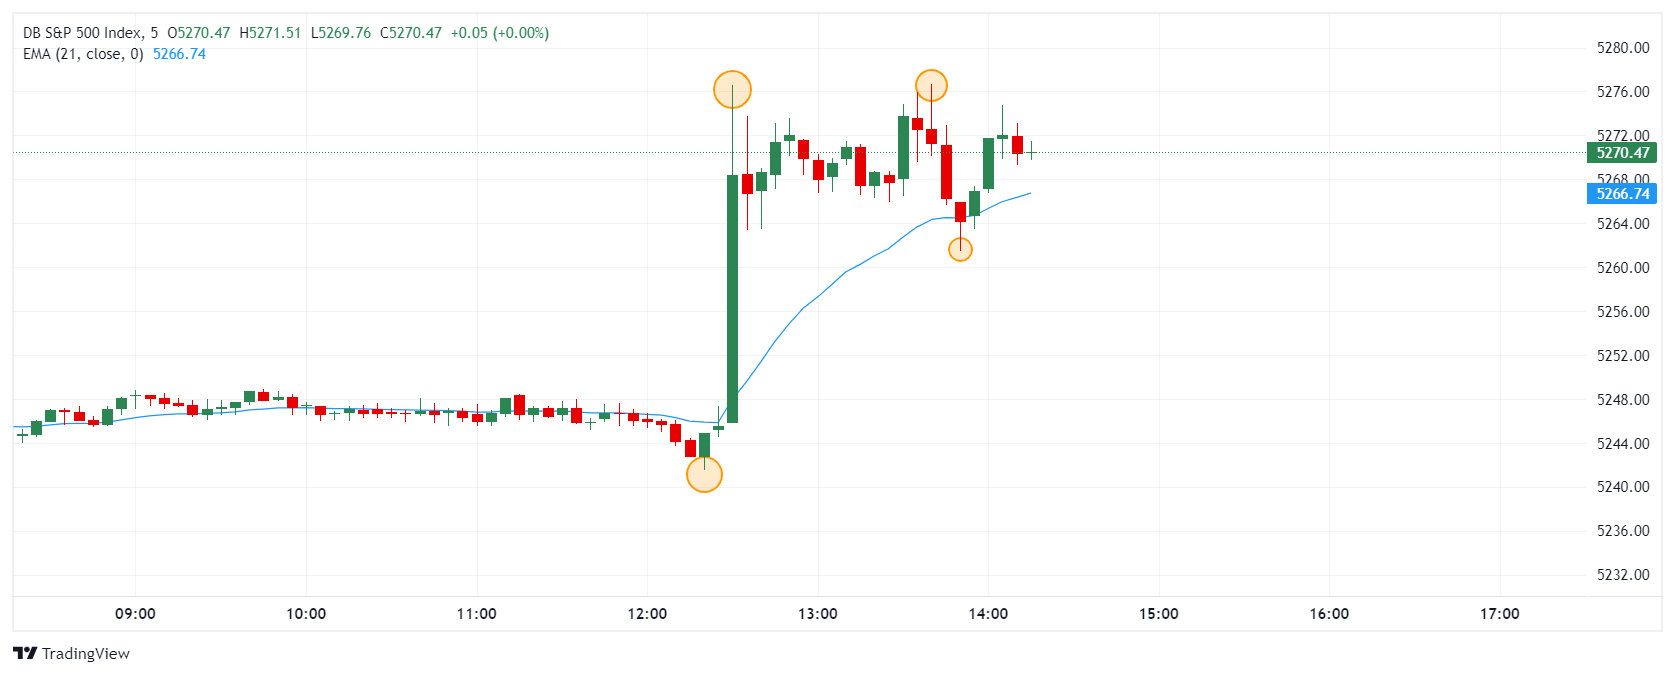
S&P 500 5-Minute Chart
S&P 500 1-hour chart
Source: Fx Street
I am Joshua Winder, a senior-level journalist and editor at World Stock Market. I specialize in covering news related to the stock market and economic trends. With more than 8 years of experience in this field, I have become an expert in financial reporting.


