
- The DXY rebounds and breaks above 103.00.
- A further bounce could see the 100-day SMA revisited.
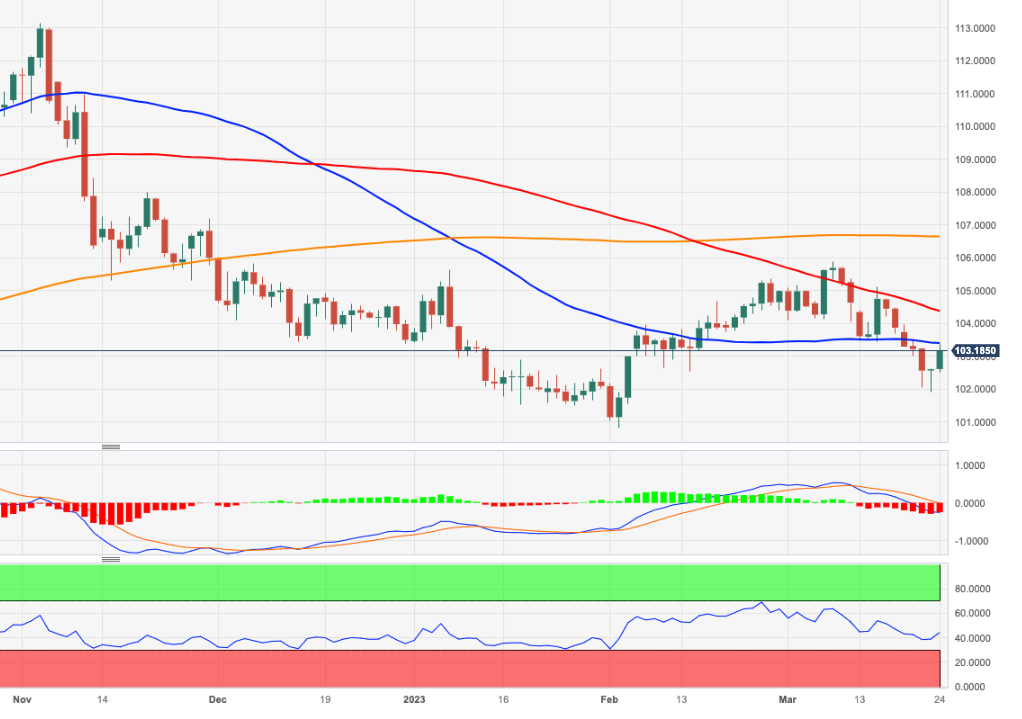
The US dollar index (DXY) it leaves behind Thursday’s lows in the area below 102.00 and recovers to 103.00 quite convincingly.
The initial bullish barrier lies at the temporary 55-day SMA near 103.40, while the continuation of the bounce is expected to find another tentative resistance at the 100-day SMA at 104.37.
On a bigger picture, as long as it holds below the 200-day SMA, today at 106.60, the outlook for the index is expected to remain negative.
DXY daily chart
Source: Fx Street
I am Joshua Winder, a senior-level journalist and editor at World Stock Market. I specialize in covering news related to the stock market and economic trends. With more than 8 years of experience in this field, I have become an expert in financial reporting.


