
- The DXY attempts a slight bounce towards the 102.70/75 zone on Wednesday.
- The monthly low near 101.90 emerges as a decent support zone.
He US dollar index (DXY) tries to shake off some of the recent bearish pressure, although the upside faltered near 102.70 on Wednesday.
Meanwhile, it appears that the index has entered a consolidation phase. The drop below the March low at 101.91 (March 23) is expected to encourage sellers to return to the market and open the door for a possible visit to the 2023 low around 100.80 (Feb 2).
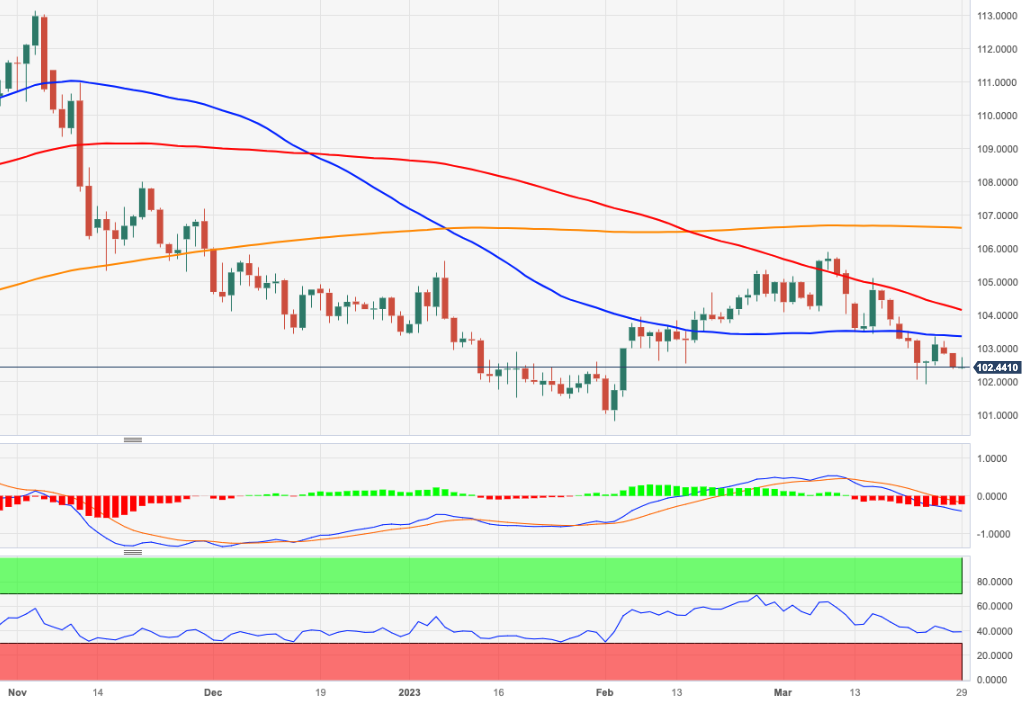
On a bigger picture, as long as it holds below the 200-day SMA, today at 106.57, the outlook for the index is expected to remain negative.
DXY daily chart
Source: Fx Street
I am Joshua Winder, a senior-level journalist and editor at World Stock Market. I specialize in covering news related to the stock market and economic trends. With more than 8 years of experience in this field, I have become an expert in financial reporting.


