
- DXY extends weekly retracement below 105.00.
- Further south is the weekly low near 104.40.
He DXY has been losing ground for the last three sessions and has opened the door to additional short-term losses.
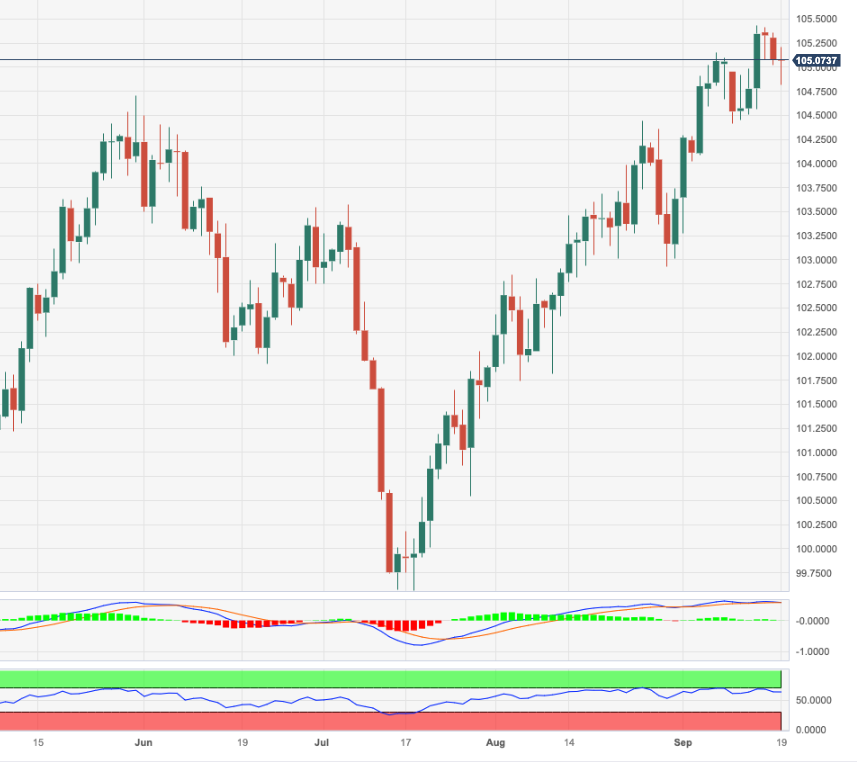
Should the corrective decline pick up further, the DXY could extend the decline to initially the weekly low of 104.42 (September 11). A sustained pullback below this latest level could see the index embark on a possible test of the critical 200-day SMA, today at 103.03.
As long as it remains above the 200-day SMA, the outlook for the DXY will remain constructive.
DXY Daily Chart
Source: Fx Street
I am Joshua Winder, a senior-level journalist and editor at World Stock Market. I specialize in covering news related to the stock market and economic trends. With more than 8 years of experience in this field, I have become an expert in financial reporting.


