
The DXY maintains the negative performance at the lows of 103.00.
The next bearish level is the weekly low of 102.93.
He US Dollar Index (DXY) extends its decline for the fourth consecutive session on Tuesday.
Further weakness in the index is expected to challenge the key support at 103.00 sooner rather than later. Loss of this region exposes the weekly low of 102.93 (Aug 30) before another round level at 102.00.
Meanwhile, below the key 200-day SMA (103.60), the DXY outlook is expected to remain bearish.
DXY Daily Chart
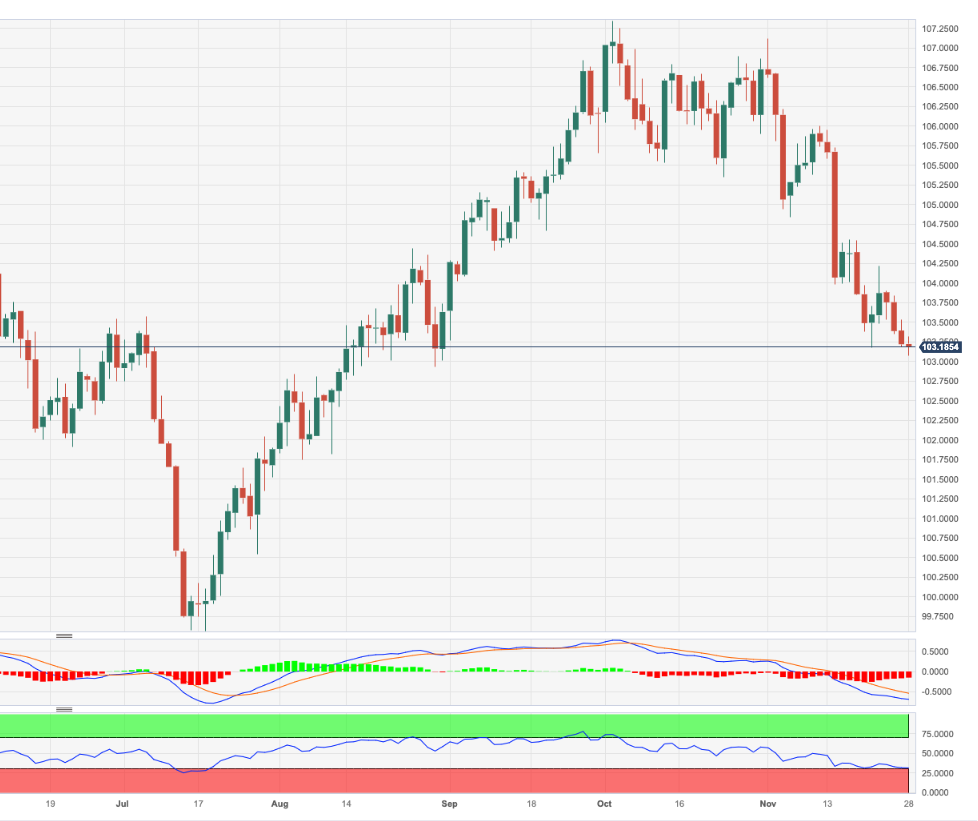
Source: Fx Street
I am Joshua Winder, a senior-level journalist and editor at World Stock Market. I specialize in covering news related to the stock market and economic trends. With more than 8 years of experience in this field, I have become an expert in financial reporting.


