
- DXY resumes decline and tests 104.00.
- Breaking 104.00 could lead to additional losses.
He US Dollar Index (DXY) reverses two consecutive daily advances and resumes the downtrend on Friday.
Should the bears regain control, the break of the November low of 103.98 (Nov 14-15) should pave the way for a quick test of the critical 200-day SMA at 103.61 before the weekly low of 102.96 (30 of August).
Meanwhile, as long as it remains above the key 200-day SMA, the outlook for the DXY is expected to remain constructive.
DXY Daily Chart
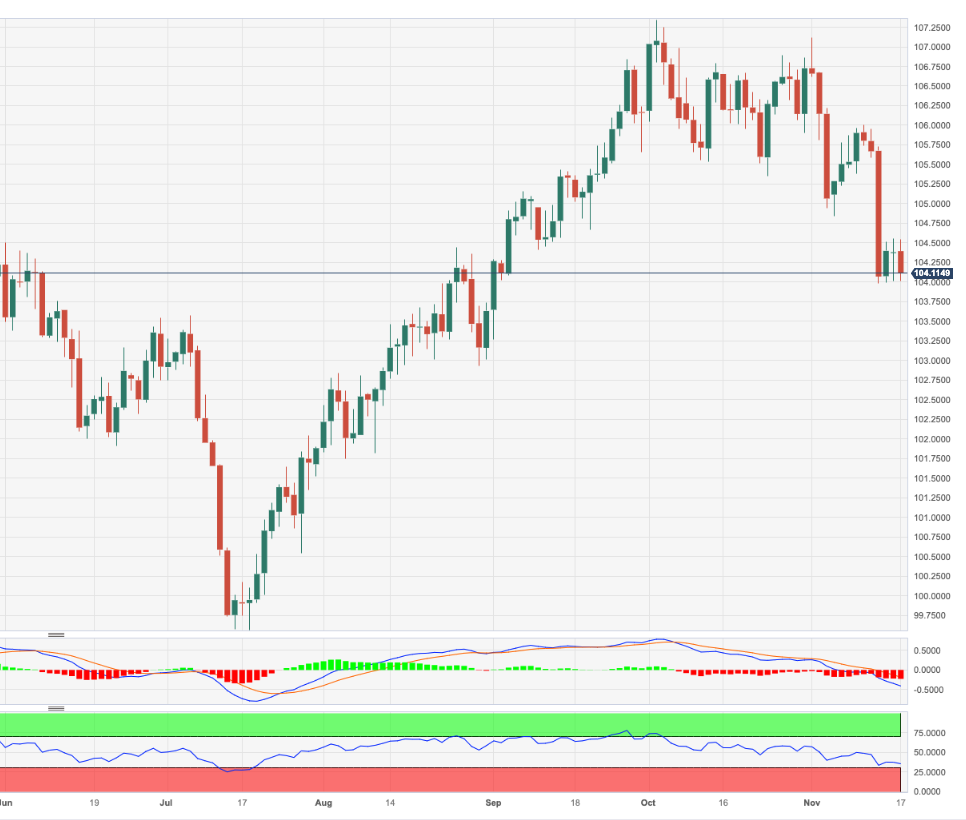
Source: Fx Street
I am Joshua Winder, a senior-level journalist and editor at World Stock Market. I specialize in covering news related to the stock market and economic trends. With more than 8 years of experience in this field, I have become an expert in financial reporting.


