
- EUR/JPY adds to Thursday’s corrective decline.
- Further losses are expected in the short term.
He EUR/JPY is under additional selling pressure following Thursday’s 2023 highs north of the 164.00 barrier.
Continuation of the pullback from overbought levels seems in sight for the moment. Conversely, the cross could initially revisit the provisional 55-day SMA near 158.80 before the weekly low of 157.69 (Oct 30).
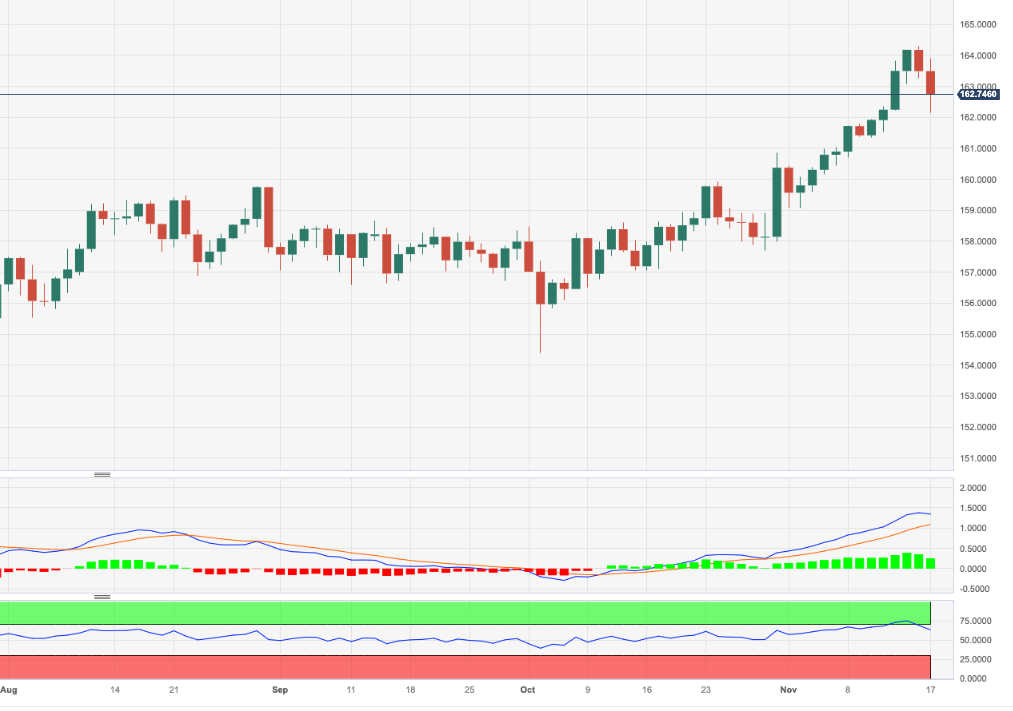
For now, the positive long-term outlook for the cross seems favored as long as it remains above the 200-day SMA, today at 152.68.
EUR/JPY Daily Chart
Source: Fx Street
I am Joshua Winder, a senior-level journalist and editor at World Stock Market. I specialize in covering news related to the stock market and economic trends. With more than 8 years of experience in this field, I have become an expert in financial reporting.


