
- The US Dollar Index (DXY) pulls back to the 104.50 area after failing near 104.70.
- Breaking above 105.00 should expose a test of the 2022 high.
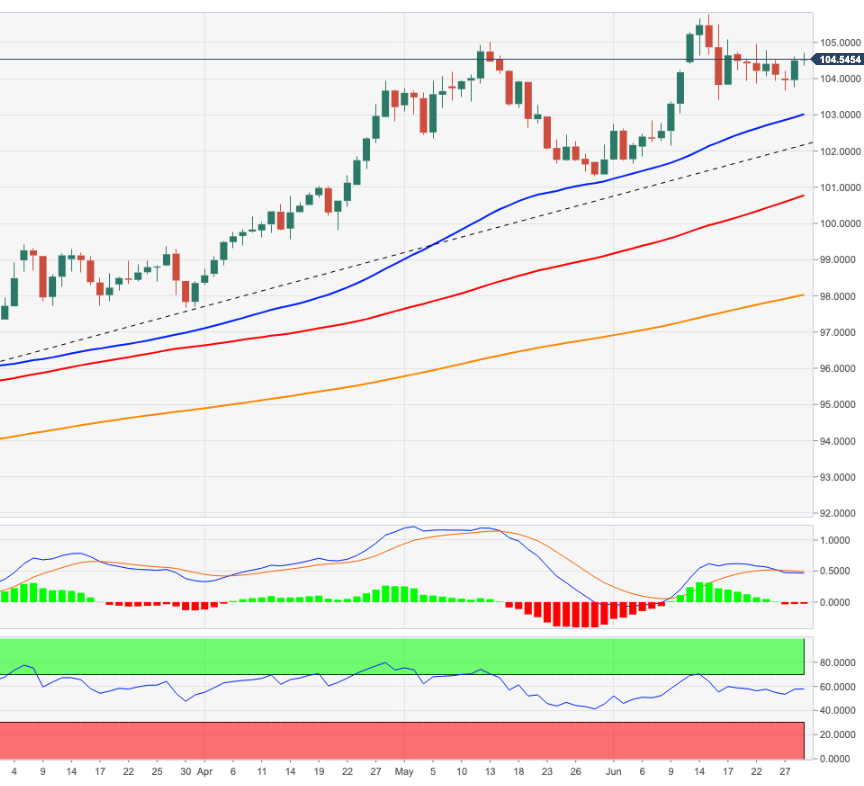
The US Dollar Index (DXY) looks to add to Tuesday’s gains, although the bull run appears to have faltered around the 104.70 area on Wednesday.
Ideally, the index should break above the weekly high near 105.00 (June 22) in the short term for the recovery to gain momentum and attempt to visit the near 20-year high around 105.80 (June 15).
As long as the 4-month line near 102.25 contains the downside, the short-term outlook for the index should remain constructive.
In the longer term, the outlook for the dollar is bullish as long as it is above the 200-day SMA at 98.01.
DXY daily chart
Technical levels
Source: Fx Street
With 6 years of experience, I bring to the table captivating and informative writing in the world news category. My expertise covers a range of industries, including tourism, technology, forex and stocks. From brief social media posts to in-depth articles, I am dedicated to creating compelling content for various platforms.


