
- DXY rises to fresh highs near 110.30 on Monday.
- A technical correction should not be ruled out.
The US Dollar Index (DXY) extends the rise to the 110.30 zone, where it seems to have found some initial resistance.
The short-term bullish view on the dollar holds for now and is underpinned by the 7-month support line today around 105.70.
However, the current overbought conditions in the index could trigger some downward correction, which should be seen as a buying opportunity.
Continuing with the uptrend, the breakout of the recent high could face the next barrier at the weekly highs of 111.90 (June 6, 2002) and 113.35 (May 24, 2002).
Looking at the long-term scenario, the bullish view on the dollar holds as long as it is above the 200-day SMA at 101.06.
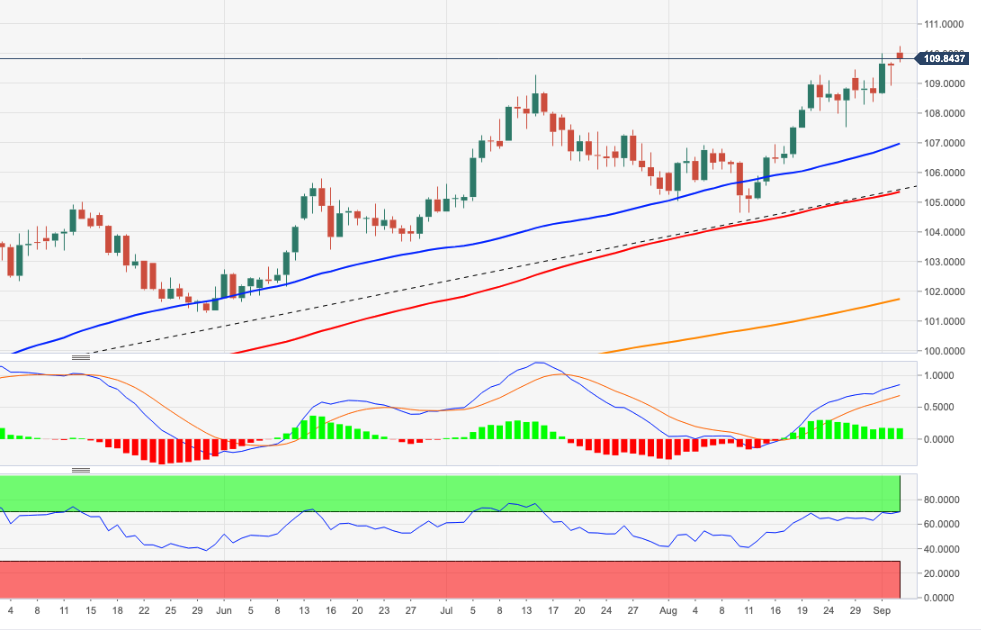
DXY daily chart
Technical levels
Source: Fx Street
With 6 years of experience, I bring to the table captivating and informative writing in the world news category. My expertise covers a range of industries, including tourism, technology, forex and stocks. From brief social media posts to in-depth articles, I am dedicated to creating compelling content for various platforms.


