
- The DXY recovers part of the losses registered on Thursday.
- Good support is found in the 102.00/101.90 zone.
The US Dollar Index (DXY) manages to regain some footing and bounces from the previous pullback to the 102.00 area.
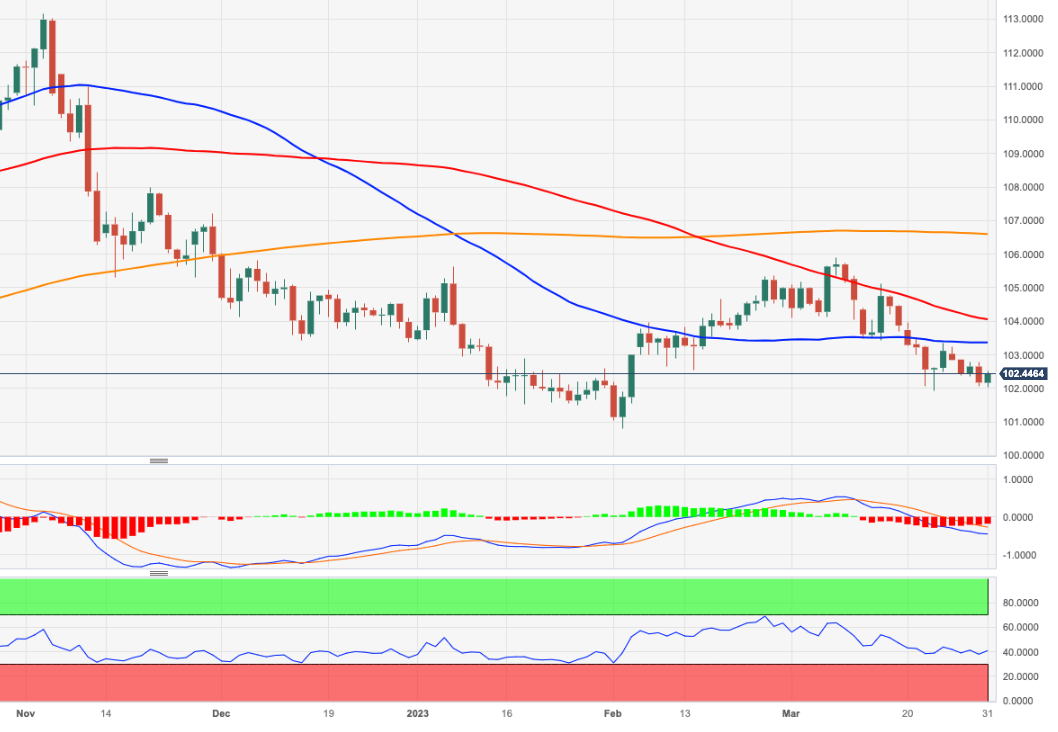
For now, it looks like the index could extend the consolidation range amid a broader bearish stance. That being said, a drop below the monthly low at 101.91 (March 23) would open the door for a possible visit to the 2023 low around 100.80 (Feb 2).
On a bigger picture, as long as it remains below the 200-day SMA, today at 106.55, the outlook for the index will remain negative.
DXY daily chart
Source: Fx Street
I am Joshua Winder, a senior-level journalist and editor at World Stock Market. I specialize in covering news related to the stock market and economic trends. With more than 8 years of experience in this field, I have become an expert in financial reporting.


