
- DXY breaks the 105.00 barrier with some conviction.
- The 2022 high near 105.80 (June 15) is next.
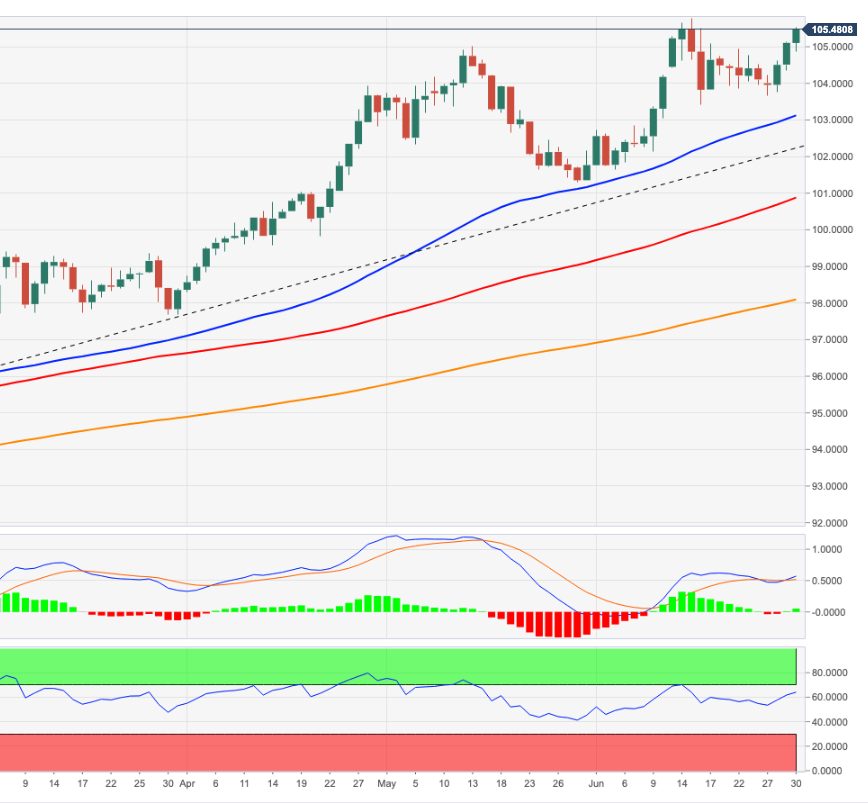
The US Dollar Index (DXY) advances for the third session in a row and looks to consolidate the recent breakout of the 105.00 barrier on Thursday.
The index has quickly moved past the weekly high near 105.00 (June 22) and in doing so has opened the door for a possible relatively quick visit to 2022 highs near 105.80 (June 15).
As long as the 4-month line near 102.30 contains the downside, the short-term outlook for the index should remain constructive.
In the longer term, the dollar’s outlook is bullish as long as it is above the 200-day SMA at 98.08.
DXY daily chart
Technical levels
Source: Fx Street
With 6 years of experience, I bring to the table captivating and informative writing in the world news category. My expertise covers a range of industries, including tourism, technology, forex and stocks. From brief social media posts to in-depth articles, I am dedicated to creating compelling content for various platforms.


 of the afternoon five news")
