
- USD/CAD falls amid widespread US dollar weakness.
- The SVB crisis in the United States caused an uproar in financial markets, with yields plunging.
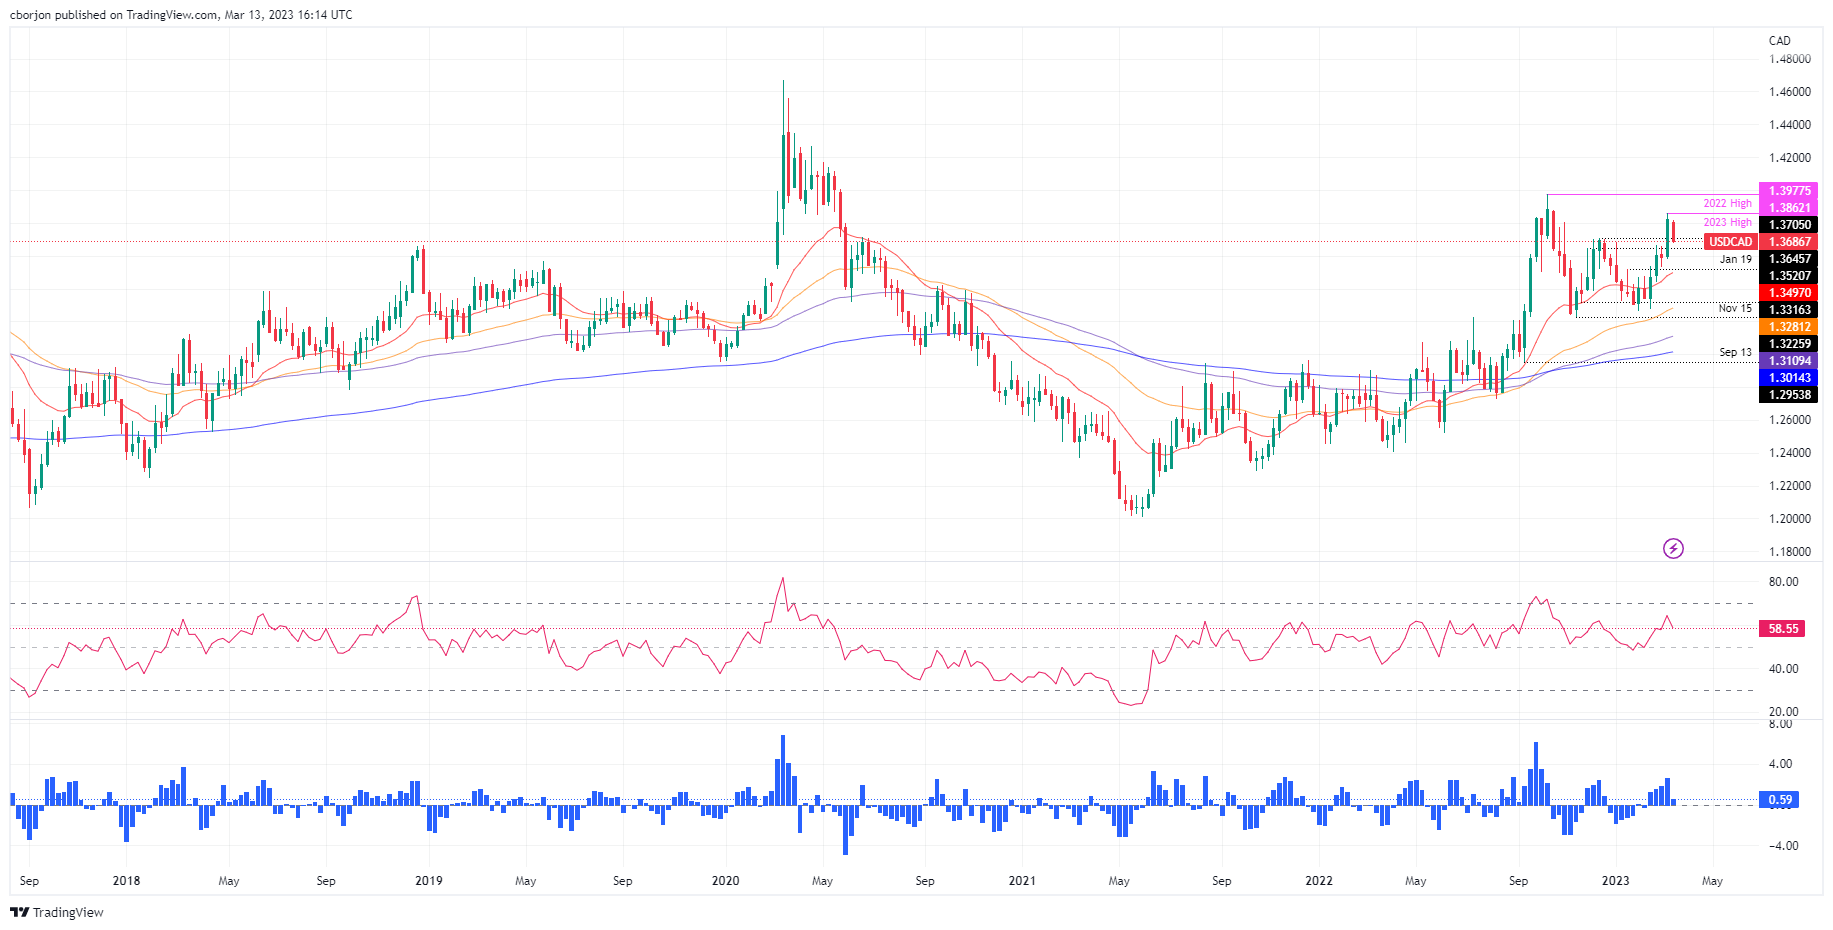
- USD/CAD Price Analysis: Short-term, neutral to bearish bias.
He USD/CAD It pulls back from the daily highs of 1.3815 and falls 0.90% due to the general weakness of the US dollar, encouraged by the ongoing crisis of the regional banks in the United States. Thus, the US Treasury yield plummets; consequently, the dollar goes down. At the time of writing, USD/CAD is trading at 1.3692.
USD/CAD Price Action
After rallying to a year high of 1.3862, the Canadian dollar (CAD) is regaining some ground, with eyes set on a daily close below the December 12 high of 1.3705. Although financial markets are punishing the US dollar (USD), safe-haven flows would increase volatility in USD-denominated currency pairs. If the banking crisis subsides, traders should expect a repricing from the Fed, so expect further USD/CAD gains.
In the short term, USD/CAD could fall towards 1.3600, but would face solid support areas. The first support would be the daily high for February 20 at 1.3665, followed by 1.3600. A break of the latter would expose the 20-day EMA at 1.3496 before testing the 50-day EMA at 1.3280.
In an alternative scenario, the first resistance of the USD/CAD would be 1.3700. Once broken, the pair could rally towards the 1.3800 zone, before testing the yearly high at 1.3862.
Oscillators like the Relative Strength Index (RSI) at 58.22 pointing lower suggest that sellers are gathering momentum. The Exchange Rate (TCC) moved towards neutral territory, showing that the buying pressure is diminishing.
Trend: Short-term, neutral to the downside.
USD/CAD Daily Chart
USD/CAD technical levels
Source: Fx Street
I am Joshua Winder, a senior-level journalist and editor at World Stock Market. I specialize in covering news related to the stock market and economic trends. With more than 8 years of experience in this field, I have become an expert in financial reporting.


