
- USD/CAD is trying to break out of a triangle chart pattern and move higher.
- A decisive breakout would reaffirm the 2024 uptrend and begin a new, more bullish phase.
USD/CAD is pushing against the upper line of a large symmetrical triangle chart pattern, threatening to break higher.
USD/CAD Daily Chart
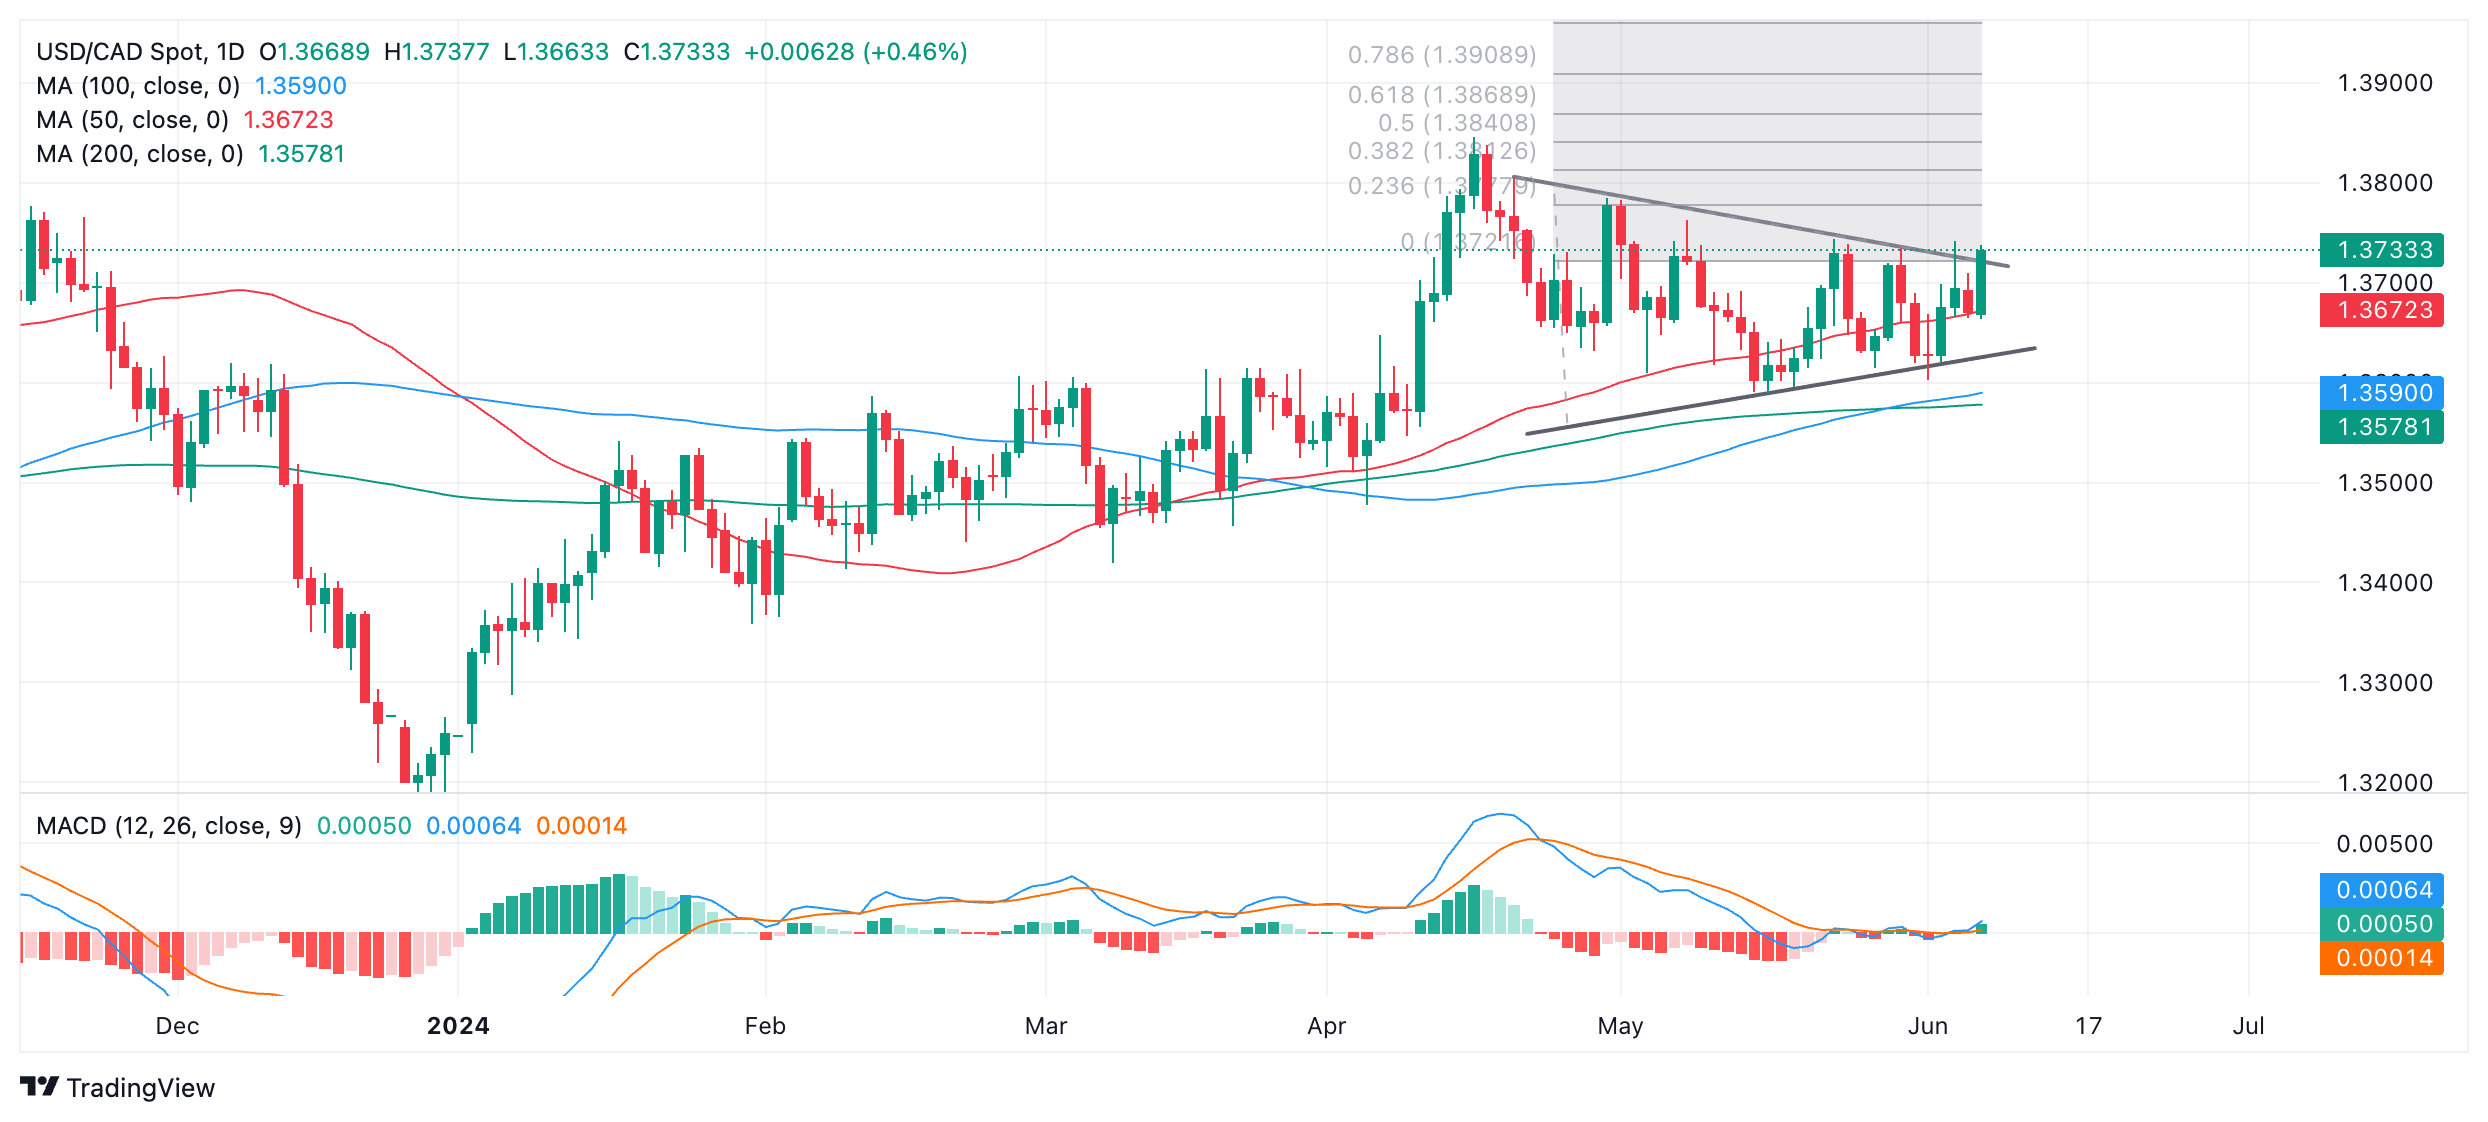
A decisive breakout of the triangle would trigger the initial upside target for the pattern at 1.3869, the 0.618 Fibonacci extrapolation of the triangle’s height from the highest breakout point.
A decisive breakout would be one accompanied by a long green daily candle that clearly broke the level and closed near its high or three green candles in a row that broke the level.
USD/CAD has been in a broadly uptrend since the start of 2024. During that time it has risen from 1.31 to the current 1.37. Since “the trend is your friend”, the odds favor a continuation of the uptrend.
Since April, USD/CAD has been trading sideways in a narrowing range like a triangle. This is a type of continuation pattern. The odds favor an upside breakout in line with the previous trend. The pattern has also completed five internal waves, which is the minimum requirement for a triangle.
The breakout, when it occurs, will likely be quite volatile. Traders are warned that false breakouts are quite common. For added confidence, a move above 1.3762 (May 8 high) should be used as confirmation.
A decisive break down of the triangle would reverse the trend and suggest a move lower towards an initial target around 1.3483.
Source: Fx Street
I am Joshua Winder, a senior-level journalist and editor at World Stock Market. I specialize in covering news related to the stock market and economic trends. With more than 8 years of experience in this field, I have become an expert in financial reporting.


