
- As investors await a hawkish Fed, USD/CHF rallies 0.80% after hot US inflation.
- High yields on US Treasuries pushed the greenback higher and weighed on stocks.
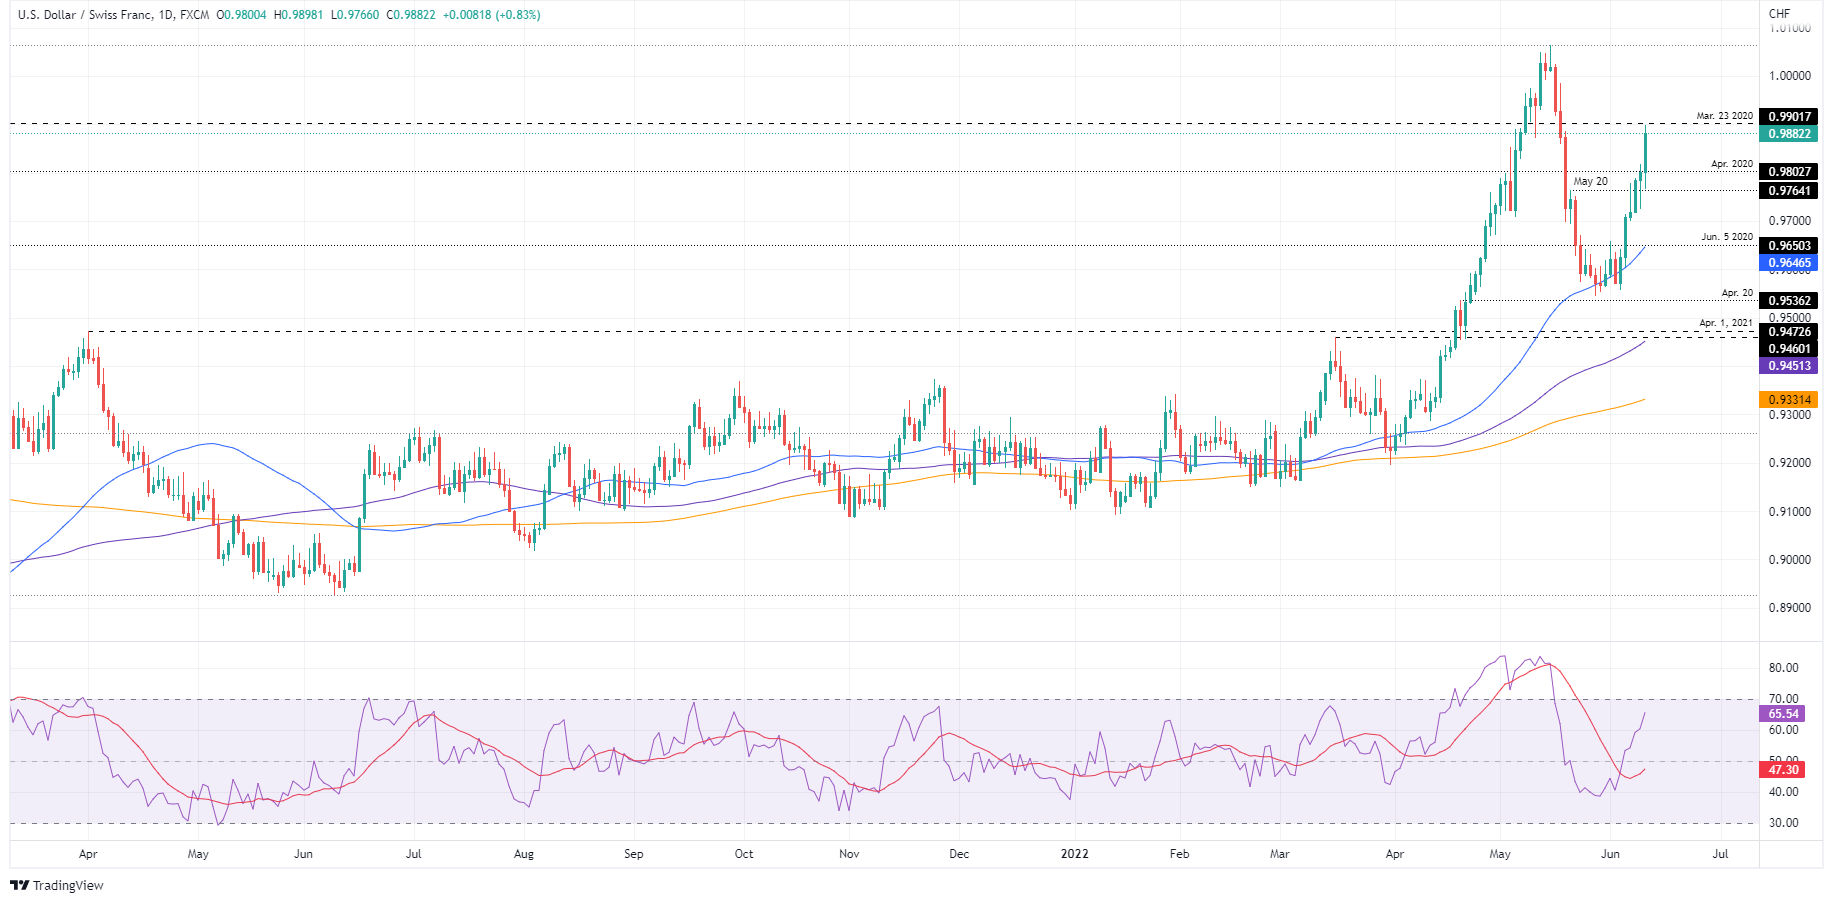
- USD/CHF Price Forecast: The pair has a bullish bias and would target parity if buyers make a daily close above 0.9885.
The USD/CHF rises sharply after the US inflation report showed the CPI approaching the 9% threshold, raising bets of a 50 basis point hike by the US Federal Reserve. , which are added to those forecast by the central bank in June and July. At 0.9882, USD/CHF approaches 0.9900 and opens the door for a parity challenge for the second time this year.
US CPI Rises, Lifting US Treasury Yields on Fed Hike Expectations, and Stocks Fall
The reflection of the US data is better reflected in the equity markets. European stocks tumbled to a loss, while US equities plummeted, shedding between 2.12% and 3% of their value. The dollar rose as US Treasury yields soared as the Treasury curve inverted.
The dollar index, a measure of the dollar’s value, advanced 0.84% to 104,177, while the benchmark 10-year US bond rose 21 basis points to 3,154%.
On Friday, USD/CHF opened around 0.9800 and dipped below this figure following news out of Japan, in particular from finance and Bank of Japan officials releasing a document threatening intervening in the foreign exchange markets. USD/CHF fell towards the daily low of 0.9766, but recovered with the US data and reached the highs of 0.9890.
USD/CHF Price Forecast: Technical Outlook
USD/CHF continues to have a bullish bias, although at the time of writing, it has pulled back from daily highs near 0.9898. However, the buyers are in control and would keep it if they make a daily close above the May 19 daily high at 0.9885. If this scenario plays out, the first resistance for USD/CHF would be 0.9900. A break above would expose the May 18 high at 0.9984, followed by a challenge to the year’s high at 1.0007.
Technical levels
Source: Fx Street
With 6 years of experience, I bring to the table captivating and informative writing in the world news category. My expertise covers a range of industries, including tourism, technology, forex and stocks. From brief social media posts to in-depth articles, I am dedicated to creating compelling content for various platforms.


