
- USD/CHF ends the week with decent gains of 0.39%.
- Risk aversion dominates the session on Friday, as it has throughout the week.
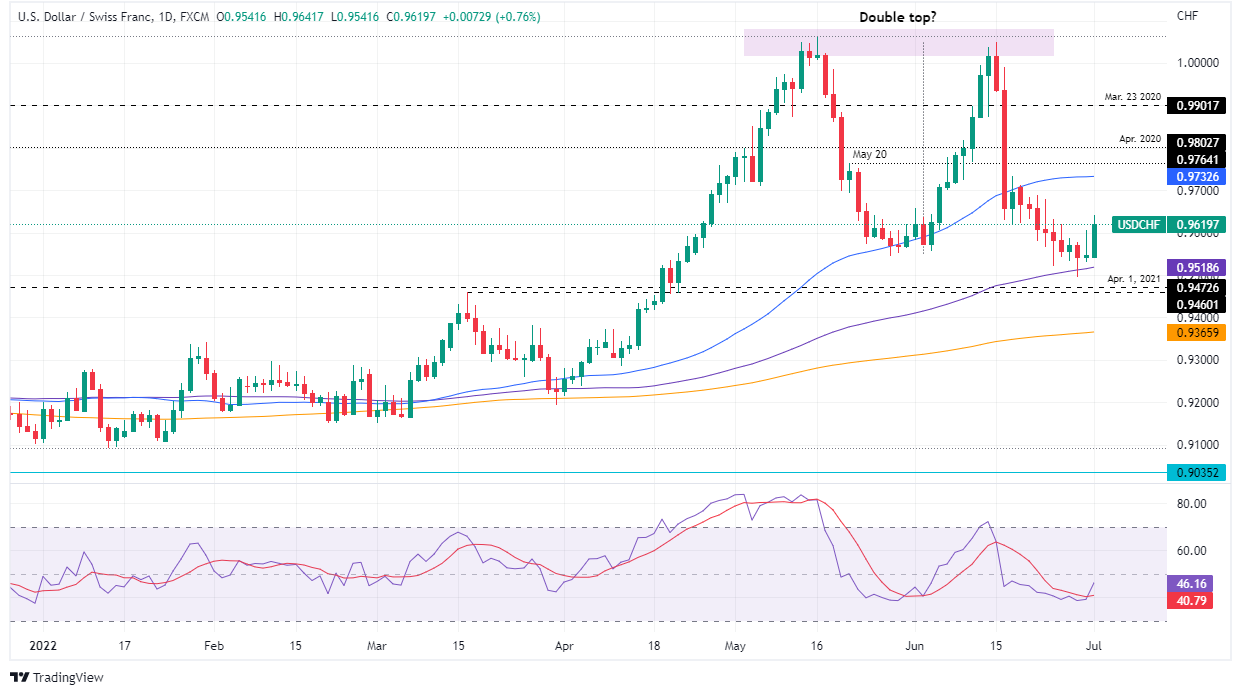
- USD/CHF double top on the daily chart is still in play but failure at 0.9544 paves the way for further gains as buyers eye 0.9700.
- In the short term, the major has a bullish bias, with an eye on the 100 DMA.
The USD/CHF accelerates and recovers the 0.9600 level after the damaging US economic data, which shows that the economy, although expanding, is doing so at a slower pace than estimated in the middle of a tightening cycle of the Federal Reserve of US At the time of writing, the USD/CHF is trading at 0.9624.
US equities are falling, preparing to end the week with significant losses. Meanwhile, US Treasury yields have recovered some ground, while the USD remains the protagonist, as shown by the dollar index, which is up 0.58% at 105.340.
USD/CHF daily chart
USD/CHF has regained some composure and is trading near the week’s highs around 0.9641. USD/CHF traders should note that sellers failed to break below the 100-day moving average (DMA) at 0.9518, exposing the pair to additional buying pressure. Also, the Relative Strength Index (RSI) at 46 pointed higher and broke above the 7-day moving average of the RSI, which means that the buying pressure is increasing.
Therefore, the first resistance of the USD/CHF would be 0.9641. If it breaks above, the 0.9700 level would be exposed, followed by the 50 day moving average at 0.9732.
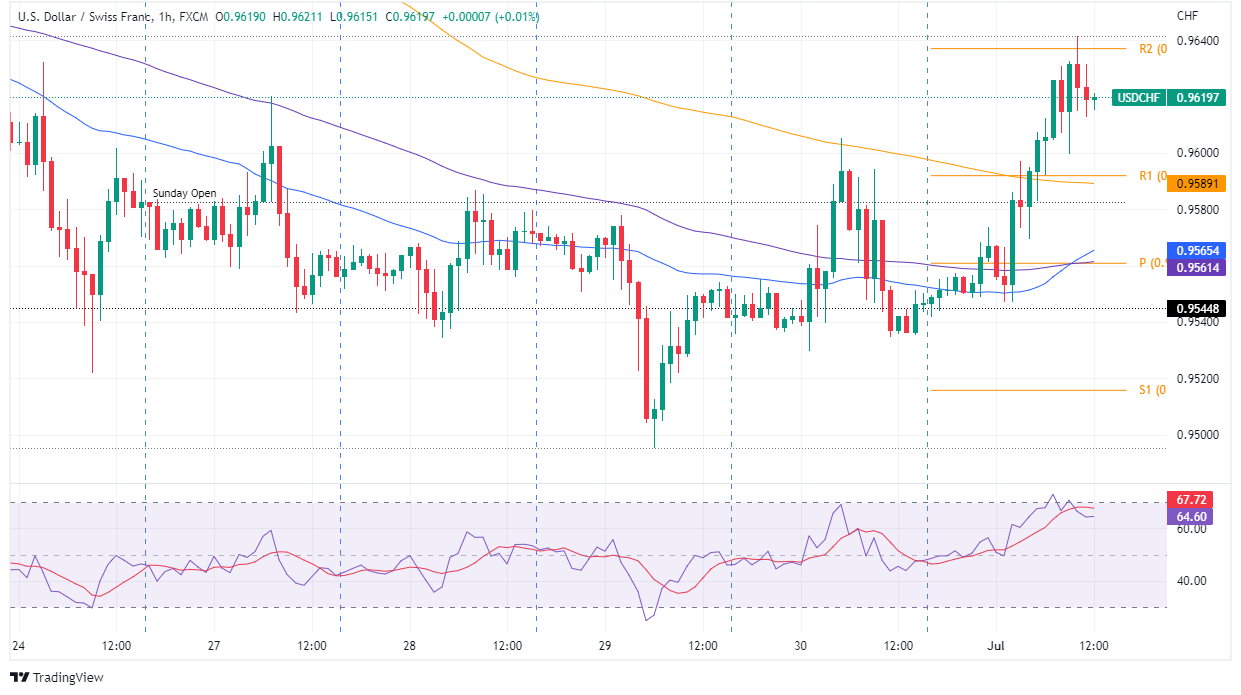
USD/CHF 1 hour chart
On the 1 hour chart, USD/CHF found its bottom around 0.9500 on June 29, and since then, has not looked back, making successive sets of higher lows and higher highs, paving the way for further gains. It should be noted that the major on its way north broke above the simple moving averages (SMAs), further solidifying the case for a rally to the upside.
Therefore, the first resistance for USD/CHF will be the R2 daily pivot at 0.9640. A break of the latter would expose the June 23 high at 0.9678, followed by 0.9700.
Key USD/CHF Technical Levels
Source: Fx Street
With 6 years of experience, I bring to the table captivating and informative writing in the world news category. My expertise covers a range of industries, including tourism, technology, forex and stocks. From brief social media posts to in-depth articles, I am dedicated to creating compelling content for various platforms.


