
- USD/CHF is correcting after the rally in late June and early July.
- It is currently developing wave C of an ABC corrective pattern.
The USD/CHF is falling in what appears to be wave C of a three-wave ABC correction. The correction stems from the rally that took place between the June 18 lows at 0.8827 to the July 3 high at 0.9051.
USD/CHF Daily Chart
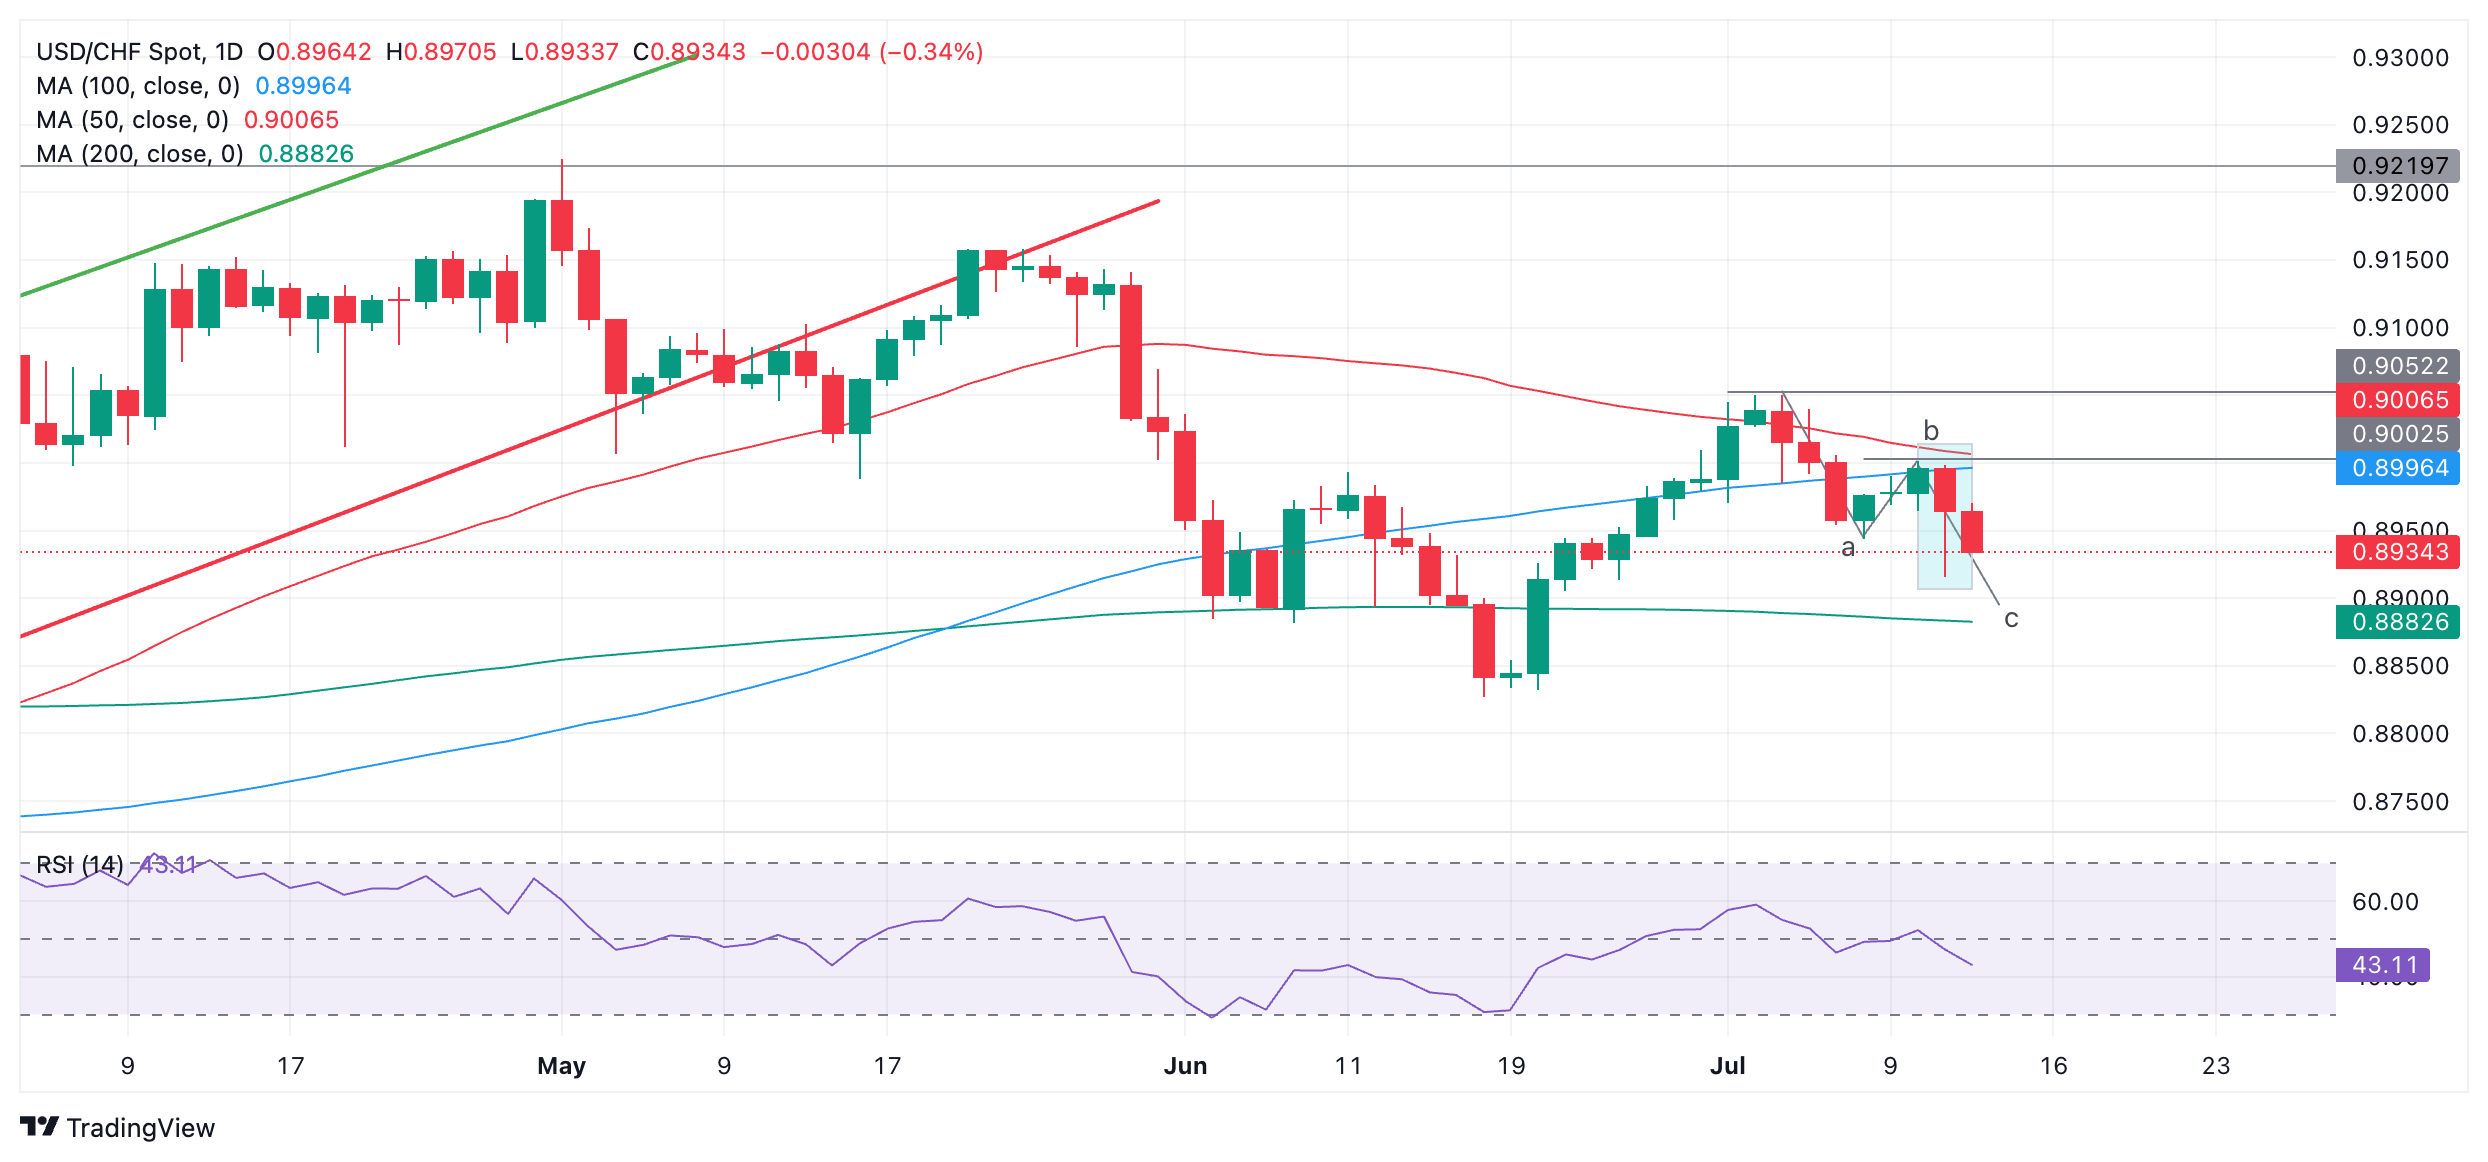
The pair has not yet reached the end of wave C and could fall further, however, it has reached the conservative target for C, which is the Fibonacci ratio of 0.618 of wave A length.
If USD/CHF falls further, it could find support at the 200-day simple moving average (SMA) at 0.8883.
Alternatively, a close above the July 10 high and the 50-day SMA at 0.9007 would likely signal an upside reversal, with the next target at 0.9051, the July 3 high.
Source: Fx Street
I am Joshua Winder, a senior-level journalist and editor at World Stock Market. I specialize in covering news related to the stock market and economic trends. With more than 8 years of experience in this field, I have become an expert in financial reporting.


