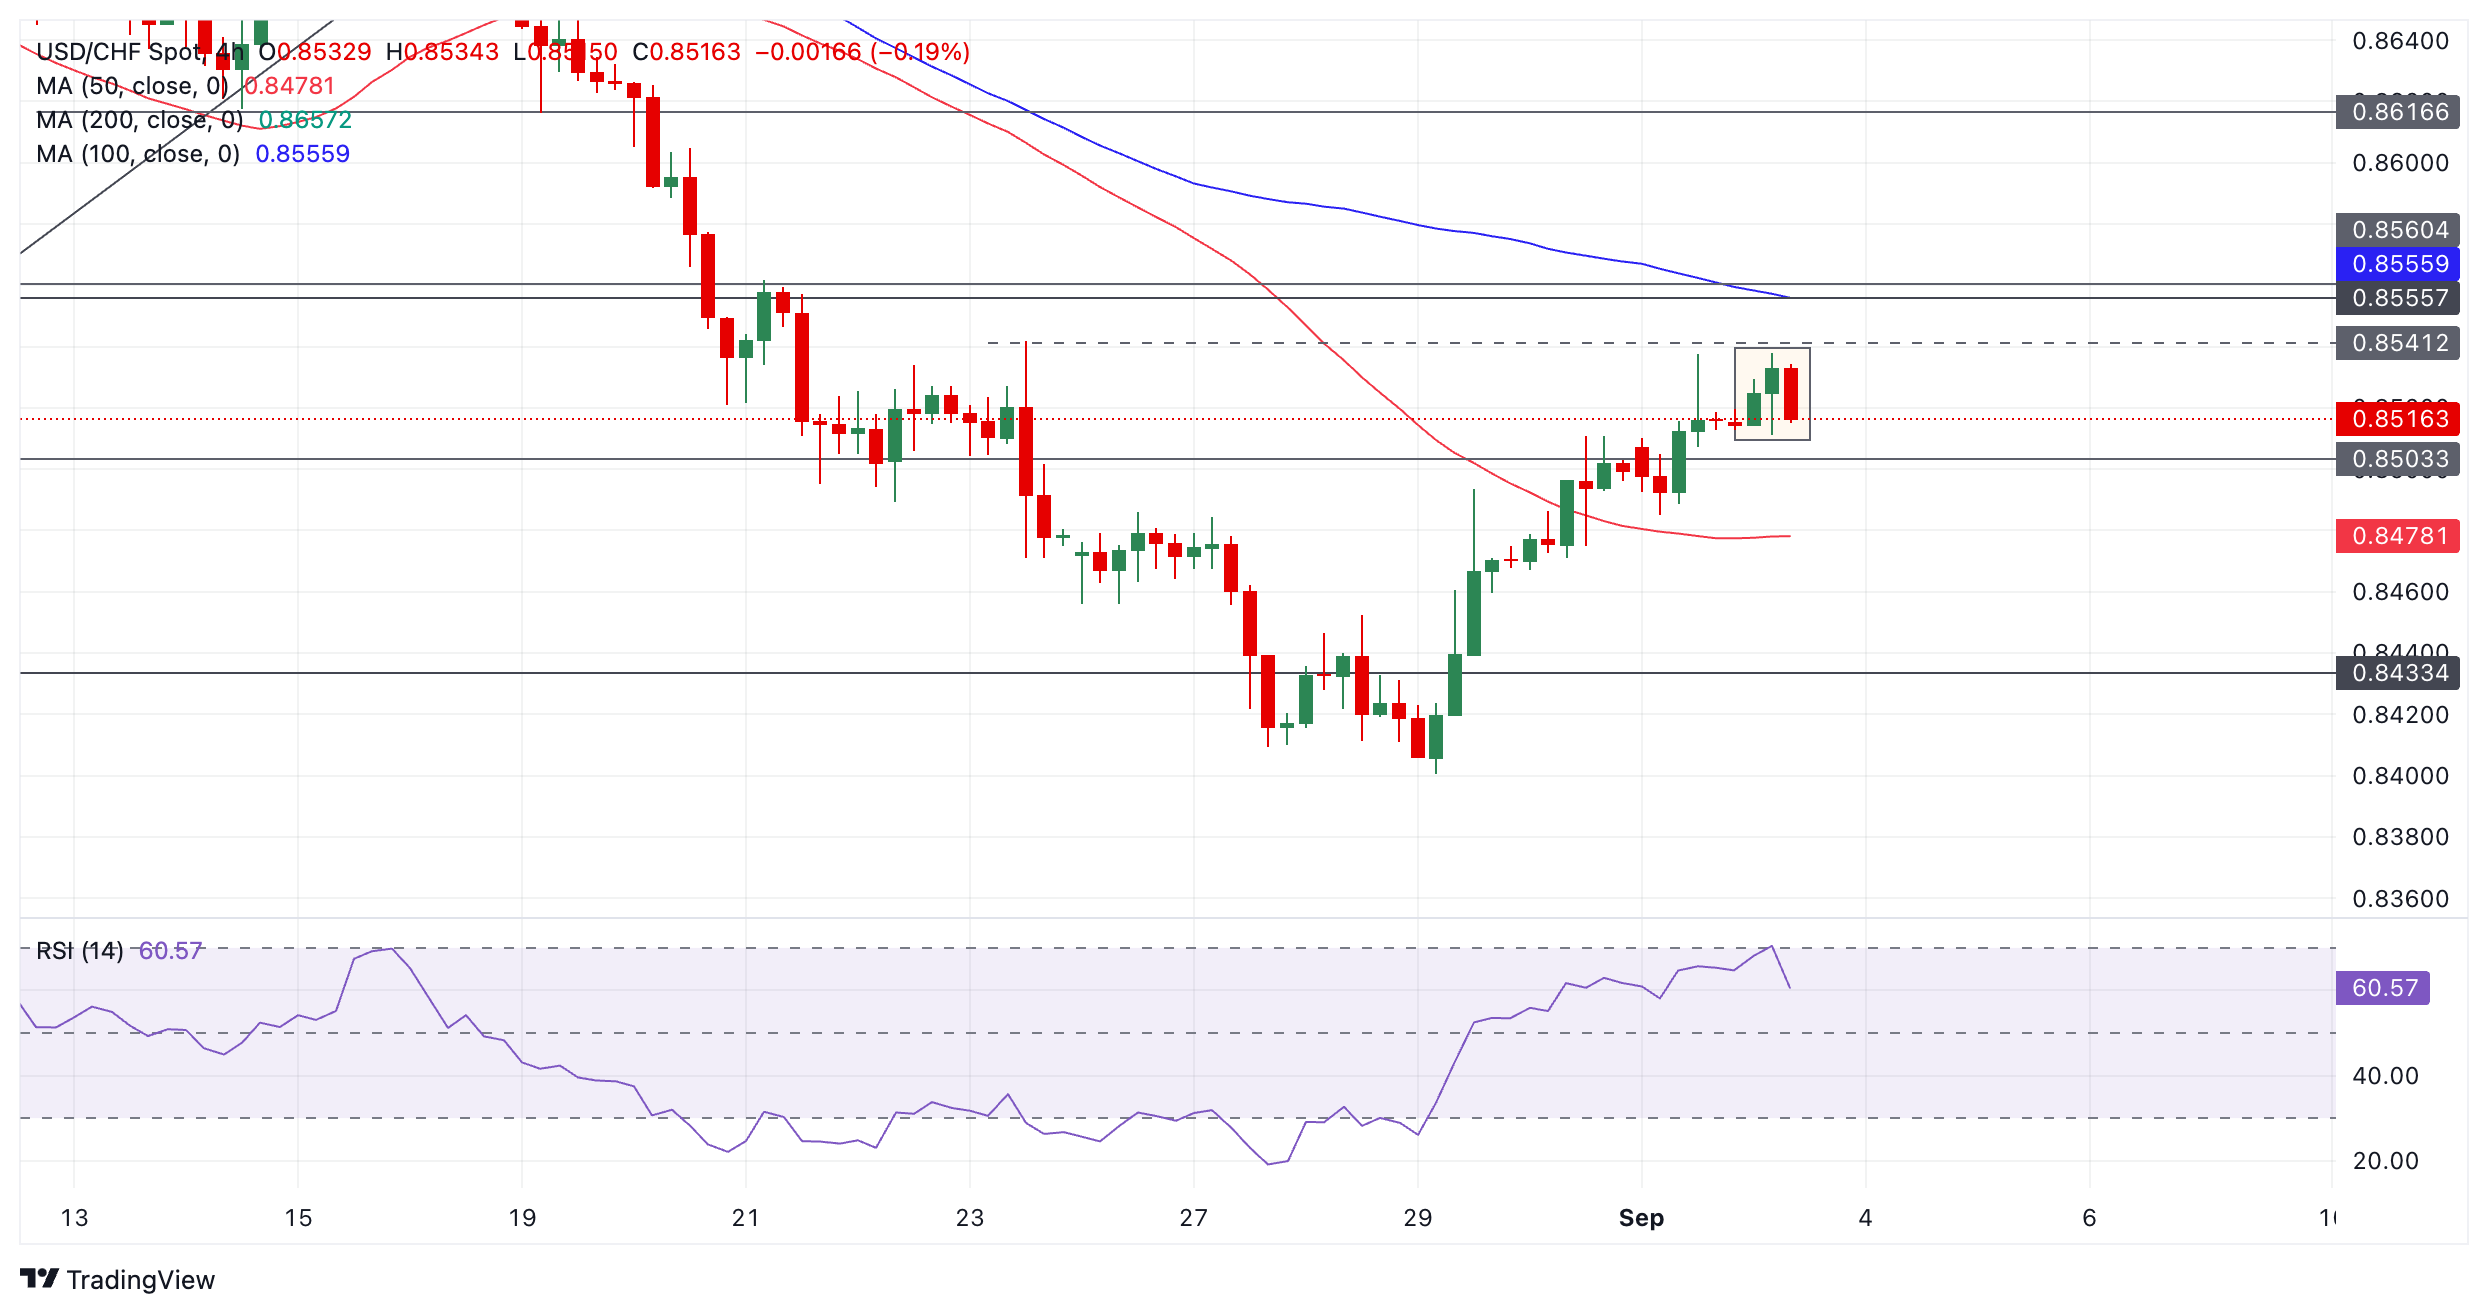
- USD/CHF has formed a new uptrend after reversing higher from the low of August 29.
- The RSI has broken out of overbought territory, indicating a risk of correction within the uptrend.
The USD/CHF has been recovering since bottoming at the lows of August 29. The pair started the uptrend with a bullish Three White Soldiers candlestick pattern right after the low of August 29. This occurs when three similarly sized green candles follow a new low.
USD/CHF has likely started a new uptrend and since “the trend is your friend”, the odds favor further upside.
USD/CHF 4-hour chart
There is a risk that the USD/CHF could temporarily pull back before continuing higher, however, as the Relative Strength Index (RSI) momentum indicator has just broken out of overbought territory. This provides a signal that the trend will likely correct or reverse.
The RSI’s exit from overbought was accompanied by the formation of a bearish Hanging Man candlestick pattern (shaded rectangle). The current candle is red and looks likely to end as a bearish candle, adding confirmation to the Hanging Man.
If a correction develops, it will likely retrace to the support at 0.8503 or 0.8485.
The dominant short-term uptrend is likely to resume eventually and take the price back higher. A break above 0.8541 (Aug. 23 high) would see resistance at 0.8557 come into play, followed by 0.8617 if the uptrend proves strong.
Source: Fx Street
I am Joshua Winder, a senior-level journalist and editor at World Stock Market. I specialize in covering news related to the stock market and economic trends. With more than 8 years of experience in this field, I have become an expert in financial reporting.


