
- The DXY remains under pressure and adds to Thursday’s losses.
- There is decent support around the March lows near 103.50.
The US Dollar Index (DXY) maintains the bearish tone in the second half of the week.
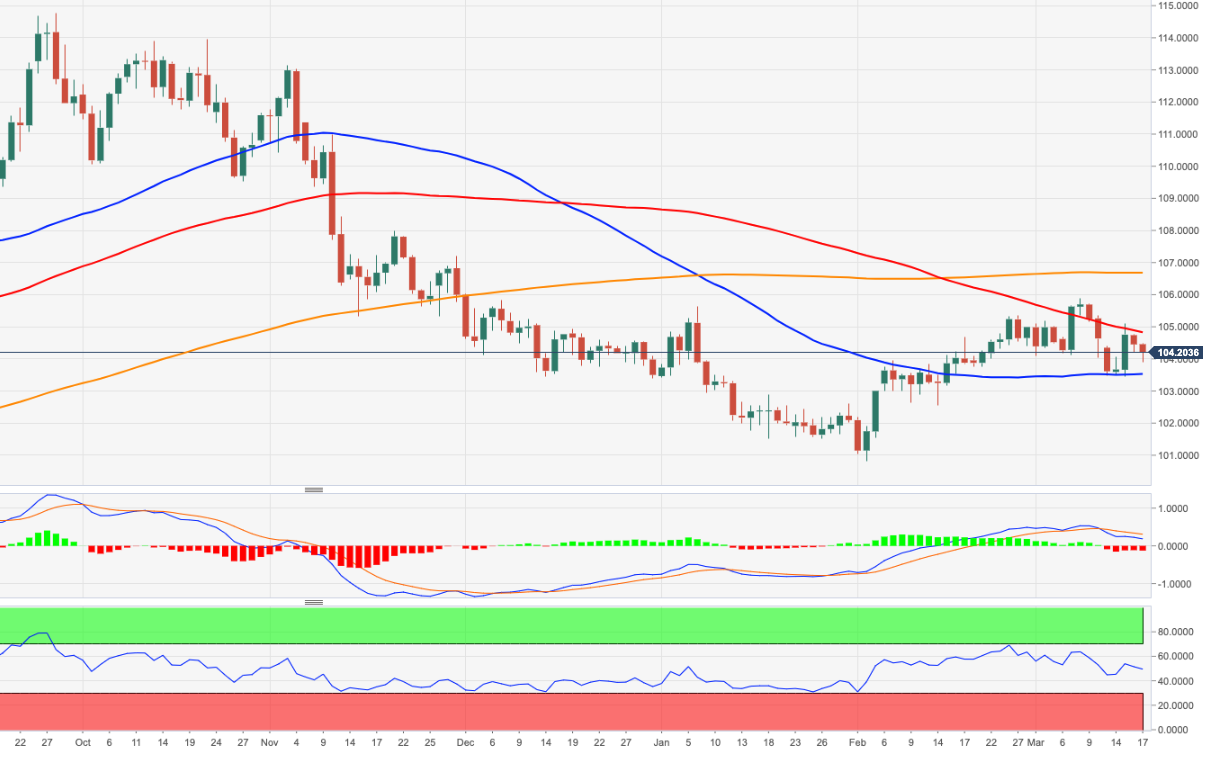
A further loss of momentum could lead the greenback to revisit the area of recent lows near 103.50, which seems underpinned by the temporary 55-day SMA. From here, the index could challenge the weekly low of 102.58 (February 14).
Overall, as long as it stays below the 200-day SMA (106.64), the outlook for the greenback will remain negative.
DXY daily chart
Source: Fx Street
I am Joshua Winder, a senior-level journalist and editor at World Stock Market. I specialize in covering news related to the stock market and economic trends. With more than 8 years of experience in this field, I have become an expert in financial reporting.


