
- USD/JPY continues to rise as markets eat the “Yentervention” declines.
- US inflation figures will dominate the trading week.
- Markets continue to expect two rate cuts in 2024 despite the inflation outlook.
USD/JPY broke above the 156.00 pair on Monday, as markets continue to chew on the Japanese Yen (JPY) gains following a pair of alleged “interventions” from the Bank of Japan (BoJ) in late April and early May . The BoJ has remained tight-lipped on the matter, refusing to officially confirm or deny direct intervention in world markets in favor of the yen. Still, the BoJ's financial operations reported a planned overspending of some nine billion Yen the same week that the Yen rallied 4.5% against the US Dollar (USD).
Markets will focus on US inflation figures due this week, although Japanese Gross Domestic Product data will be released early on Thursday. Markets are generally expecting a contraction in Japanese GDP growth, with a forecast of -0.4% in the first quarter, down from 0.1% in the previous quarter.
The US Producer Price Index (PPI) will be released on Tuesday, and core PPI inflation is expected to remain at 2.4% annually in April. On Wednesday, US Consumer Price Index (CPI) inflation is expected to hold steady at 0.4% month-on-month in April, and year-on-year headline CPI inflation is expected to decline to 3.4% from 3.5%.
Despite the recent parade of Federal Reserve (Fed) policymakers expressing caution over market hopes for rate cuts at a faster pace and sooner than the Fed can achieve, the Market hopes remain firmly placed on two Fed cuts in 2024, with the first expected to come in September. According to CME's FedWatch tool, rates markets are pricing in the odds of a rate cut in 2024 at nearly 90%, with a 65% chance of a 25 basis point cut at the Fed's rate meeting in September.
USD/JPY Technical Outlook
USD/JPY has been slow to regain ground, but the progress has been notably one-sided, as the pair moves higher, surpassing the 200-hour EMA near 155.36. The pair is testing chart territory north of the 156.00 zone and is up almost 3% from the last post-intervention low below 152.00.
USD/JPY is on track to close in the green for the fifth time in the last six trading days after a sharp decline from multi-year highs above 160.00. The long-term uptrend remains firmly intact, with the pair trading well above the 200-day EMA at 148.29.
USD/JPY hourly chart
USD/JPY daily chart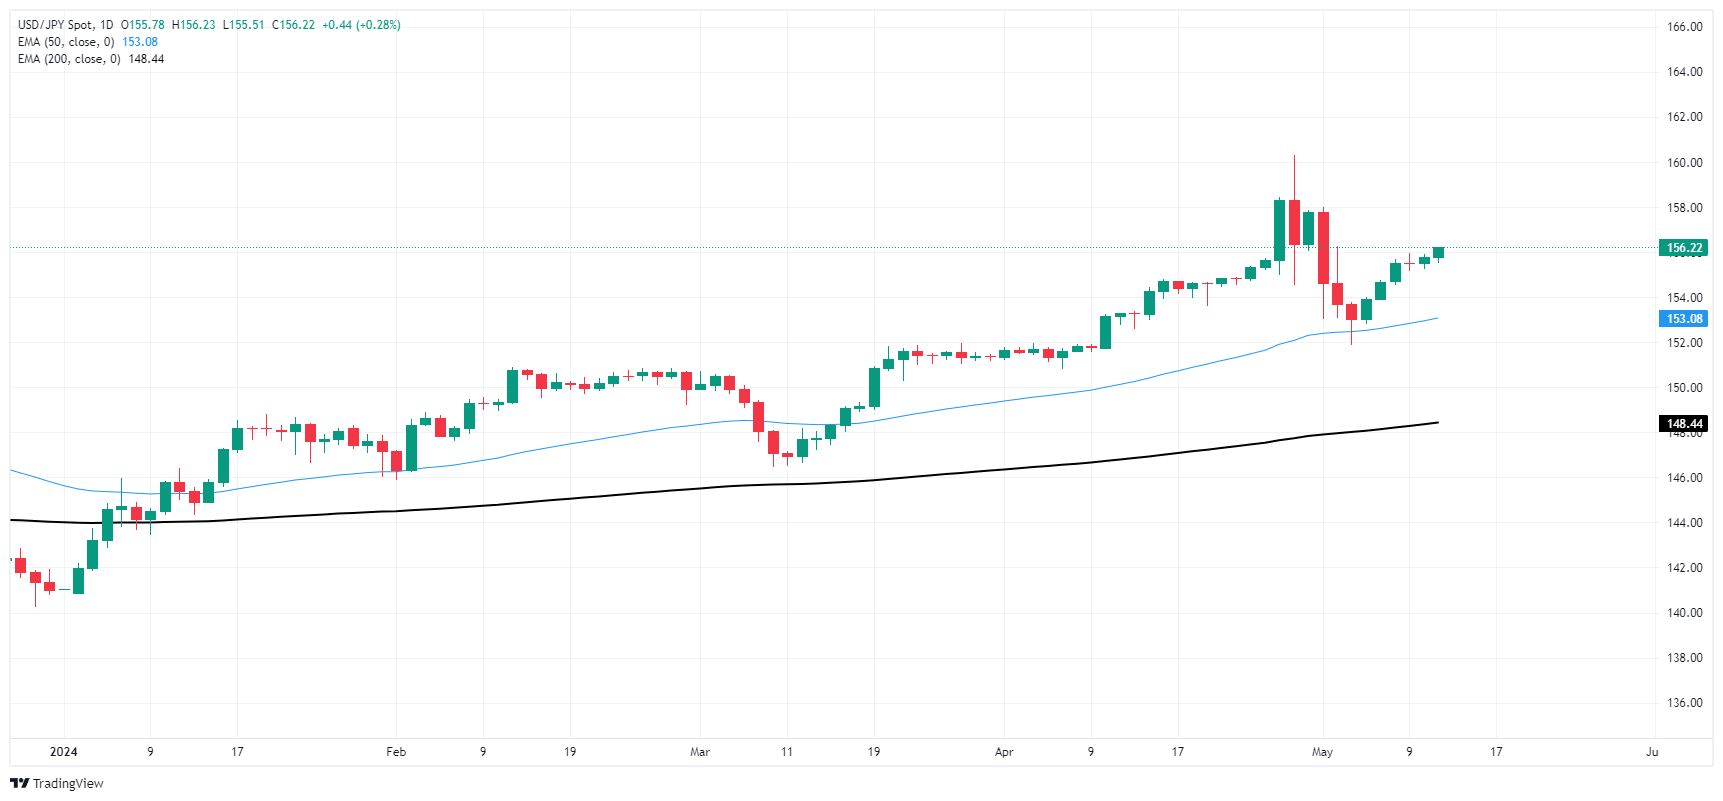
Source: Fx Street
I am Joshua Winder, a senior-level journalist and editor at World Stock Market. I specialize in covering news related to the stock market and economic trends. With more than 8 years of experience in this field, I have become an expert in financial reporting.


