
- USD/JPY extends the previous day’s decline within a bearish one-week chart pattern.
- Sustained trading below the 100 EMA and bearish signals from the MACD favor sellers of the pair.
- RSI conditions suggest that a bottom is being reached around the Fibonacci golden ratio.
- Multiple hurdles challenge Yen buyers.
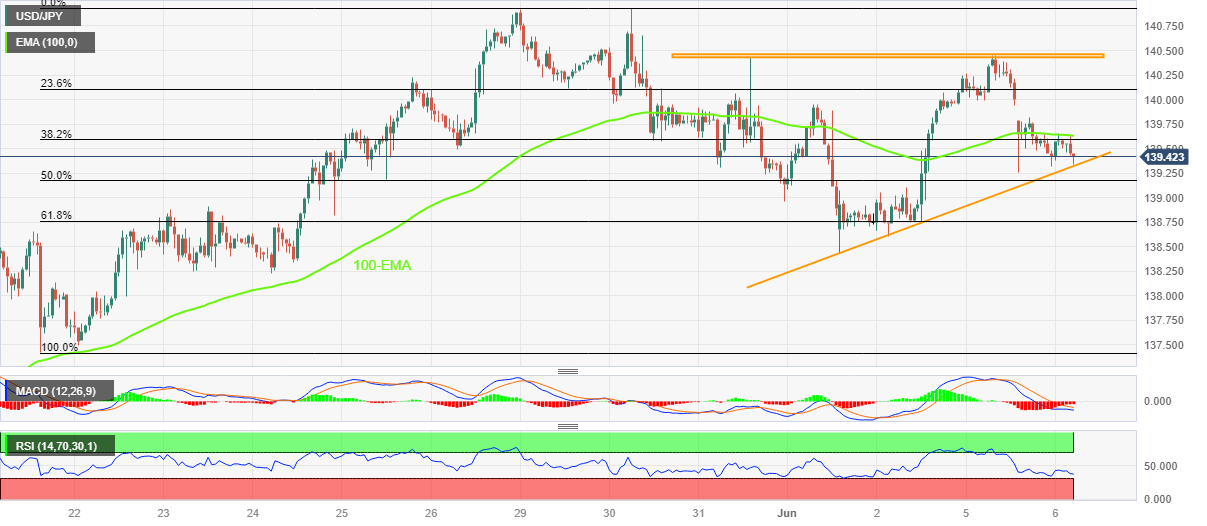
The USD/JPY pair remains in lower ground, near the intraday low around 139.35 at the start of the European session on Tuesday. In doing so, the pair defends the previous day’s downtrend within a week-old ascending triangle pattern.
In addition to the bearish triangle, the bearish signals from the MACD and the sustained move below the 100 hourly EMA also favor USD/JPY sellers.
However, a clear break below the lower line of the indicated triangle, around 139.30 at time of writing, is necessary for confirmation of further selling in the pair.
Still, the RSI (14) is close to the oversold zone and thus the 61.8% Fibonacci retracement of the May 19-30 rally near 138.75, aka the gold ratio for Fibonacci, can challenge USD/JPY bears.
Should the pair fall below the 138.75% Fibonacci support, the round level of 138.00 and the early May high around 137.70 could attract market attention.
On the other hand, the 100 EMA level at 139.65 limits the immediate rise of the USD/JPY pair. Next, the psychological magnet at 140.00 and the upper line of the triangle near 140.45-50, may challenge the bulls before leading them towards May’s multi-month high around 140.91.
USD/JPY 1 hour chart
Trend: More falls are expected
Source: Fx Street
I am Joshua Winder, a senior-level journalist and editor at World Stock Market. I specialize in covering news related to the stock market and economic trends. With more than 8 years of experience in this field, I have become an expert in financial reporting.


