
- USD/JPY fell to a fresh three-month low, but bounced towards 138.70.
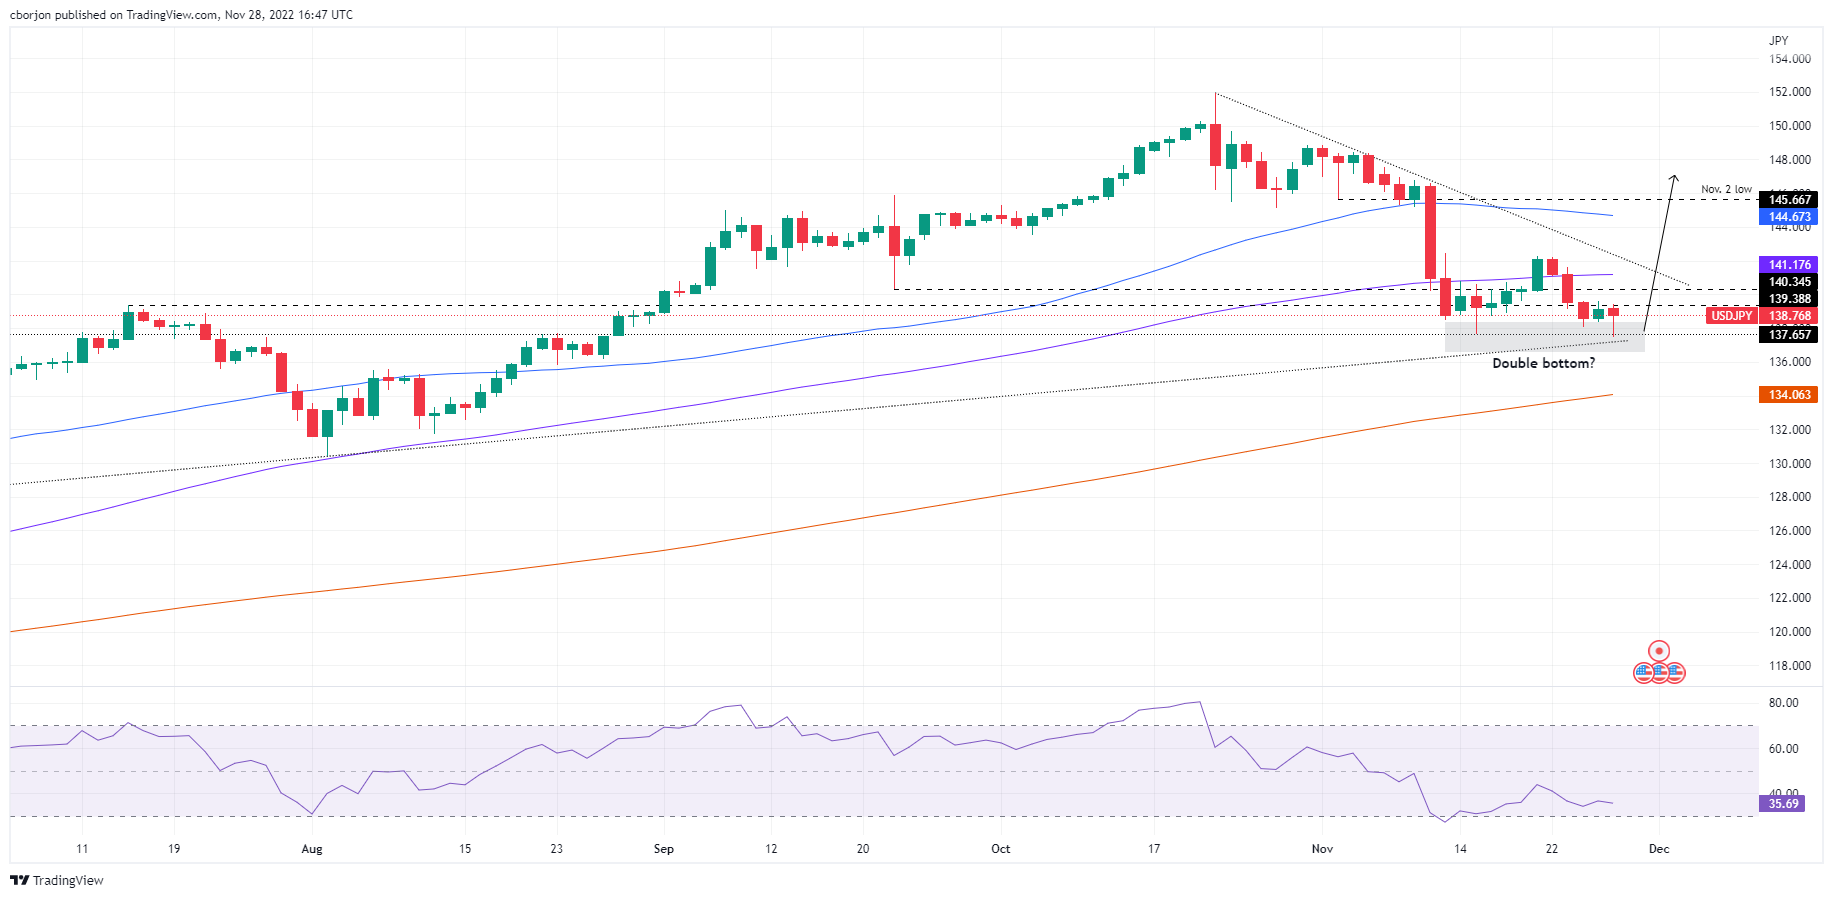
- A double bottom on the daily chart of USD/JPY points to a rally to 145.00.
- USD/JPY Price Analysis: Break above 139.00 will exacerbate a rally towards 140.00.
The USD/JPY is falling in the American session, comfortable below 139.00 after hitting a daily low of 137.49, hitting a fresh three-month low on a weakening US dollar. At the time of writing, USD/JPY is trading at 138.80, down 0.25% on the day.
USD/JPY Price Analysis: Technical Perspective
After testing over the past month at 137.00, USD/JPY bounced hard, retrieving the 138.00 figure, indicating that buyers have stepped in. The possible formation of a “double bottom” chart pattern around 137.50/60 could open the door for a rally, which could target the 50 day EMA at 144.67 as an initial target on its way. around 147.00. In particular, the Relative Strength Index (RSI) was unchanged as USD/JPY price action plunged towards a multi-month low. Therefore, a positive divergence between the RSI and the price action could pave the way for a further rise in USD/JPY.
If this scenario continues, the first resistance for USD/JPY would be 140.00. A break above will expose the 100 day EMA at 141.17, followed by the 142.00 figure, and the 50 day EMA at 144.67. In an alternative scenario, the first support for USD/JPY would be 138.00. Once broken, next support would be a multi-month low around 137.49, ahead of an uptrend line around 137.00.
Key USD/JPY Technical Levels
Source: Fx Street
I am Joshua Winder, a senior-level journalist and editor at World Stock Market. I specialize in covering news related to the stock market and economic trends. With more than 8 years of experience in this field, I have become an expert in financial reporting.


