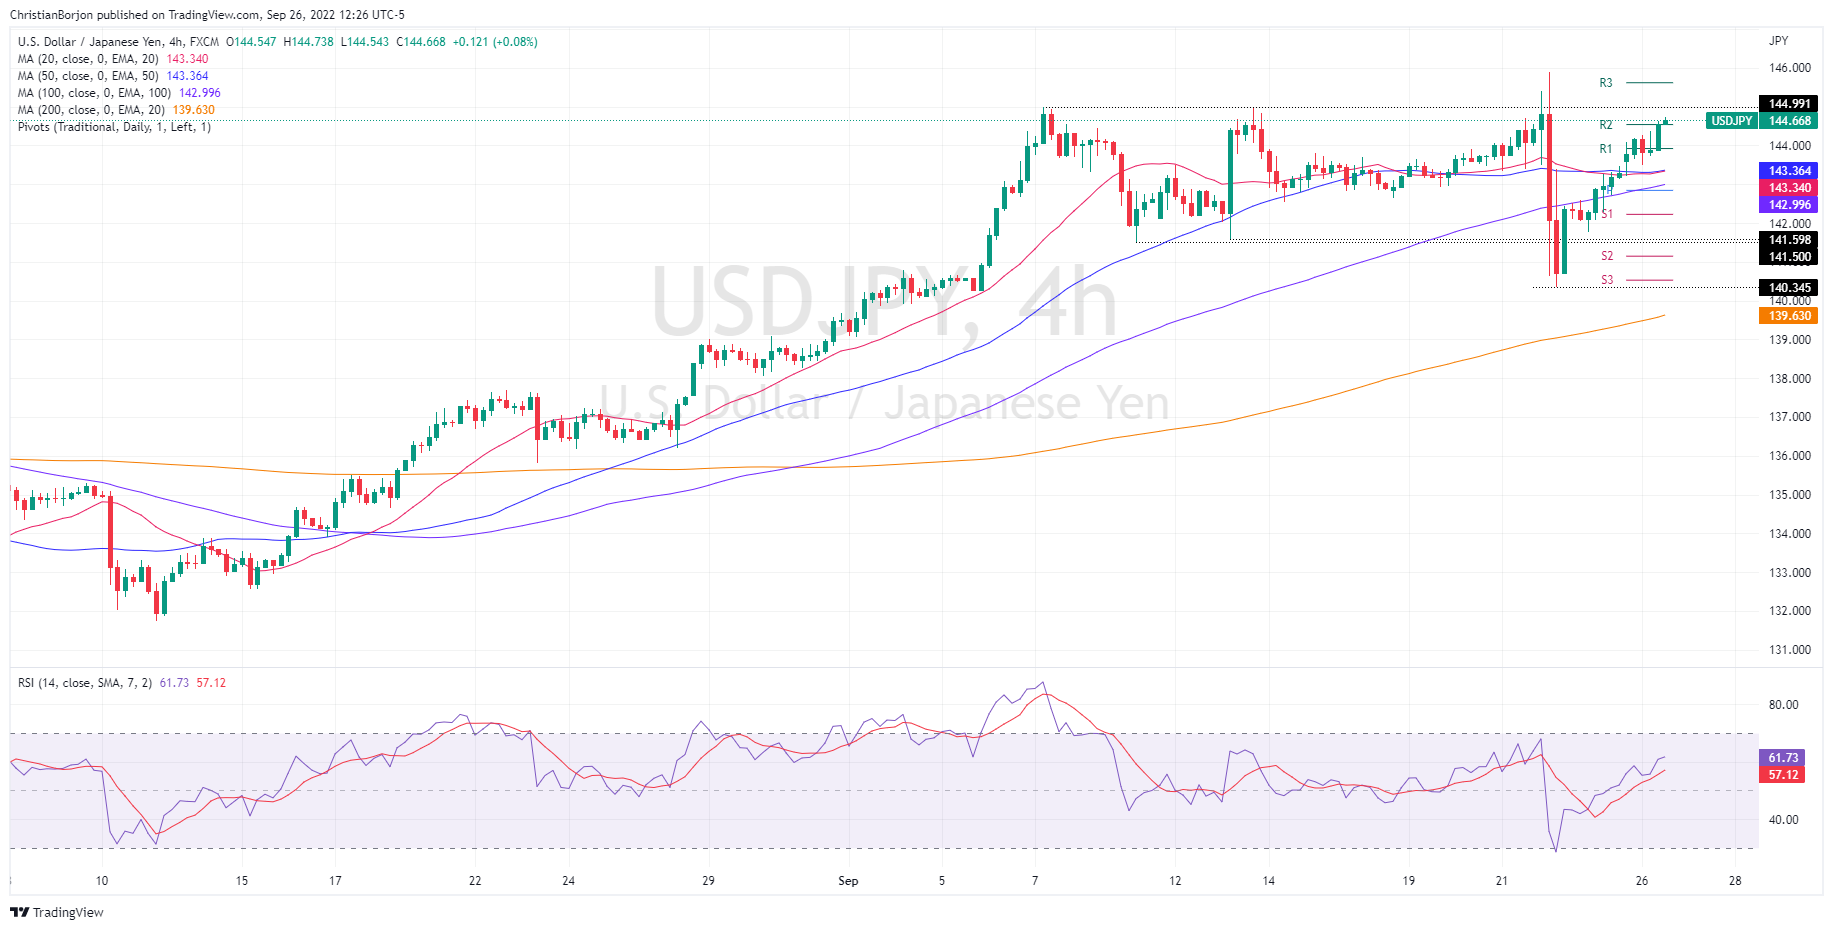
- USD/JPY rebounds from the 143.00 area and is back above 144.50 after the Bank of Japan’s intervention in the forex market last week.
- Following Japanese intervention in the forex space, USD/JPY rallied 3%.
- In the short term, USD/JPY could retest the 145.00 area, despite growing concerns that the BOJ’s sand line opens the door for another FX market intervention,
The USD/JPY is making up some ground after last week’s Bank of Japan currency intervention, which pushed the Japanese yen from 145.00 price levels towards the 140.34 zone. However, USD/JPY traders are pushing back to the 145.00 price as USD/JPY is trading around 144.66, above its opening price at the time of writing.
USD/JPY Price Analysis: Technical Outlook
USD/JPY remains bullish after falling towards the 140.00 area. It should be noted that after the intervention of the BOJ in the markets, the Relative Strength Index (RSI) fell. However, at the time of writing, the RSI has crossed above its 7-day RSI SMA, which suggests that buyers are gathering momentum as the major reaches thresholds of 144.00.
In the short term, the 4-hour scale portrays USD/JPY strength, with the major clearing the R2 daily pivot at 144.52. Furthermore, after dipping into oversold conditions, the oscillators, primarily the Relative Strength Index (RSI), are back in positive territory.
If USD/JPY breaks above the 144.99 area, it could pave the way for further FX market intervention by the Japanese authorities. If it doesn’t, USD/JPY’s next resistance would be the 21st Sep daily high at 145.39, followed by the R3 daily pivot at 145.63.
On the other hand, failure at 145.00 could see the major pair slide towards the S1 daily pivot at 143.95. A break below will expose the confluence of the 20 and 50 EMAs around 143.34/36, followed by the daily pivot at 142.85.

Key USD/JPY Technical Levels
USD/JPY
| Overview | |
|---|---|
| last price today | 144.68 |
| Today I change daily | 1.37 |
| Today’s daily variation in % | 0.96 |
| Daily opening today | 143.31 |
| Trends | |
|---|---|
| daily SMA20 | 142.21 |
| daily SMA50 | 138.14 |
| daily SMA100 | 135.45 |
| daily SMA200 | 127.21 |
| levels | |
|---|---|
| Previous daily high | 143.46 |
| Previous Daily Low | 141.76 |
| Previous Weekly High | 145.9 |
| Previous Weekly Low | 140.35 |
| Previous Monthly High | 139.08 |
| Previous Monthly Low | 130.4 |
| Daily Fibonacci of 38.2% | 142.81 |
| Daily Fibonacci of 61.8% | 142.41 |
| Daily Pivot Point S1 | 142.23 |
| Daily Pivot Point S2 | 141.15 |
| Daily Pivot Point S3 | 140.53 |
| Daily Pivot Point R1 | 143.93 |
| Daily Pivot Point R2 | 144.54 |
| Daily Pivot Point R3 | 145.62 |
Source: Fx Street
With 6 years of experience, I bring to the table captivating and informative writing in the world news category. My expertise covers a range of industries, including tourism, technology, forex and stocks. From brief social media posts to in-depth articles, I am dedicated to creating compelling content for various platforms.


