
- USD/JPY is showing a three-day uptrend, settling around the weekly high.
- The sustained break of the monthly resistance line and the bullish signal from the MACD favor the buyers.
- The bears should wait for the confluence of the ascending triangle for conviction.
The USD/JPY it has recovered about 65 pips from the Asian session low at 134.73, reaching a daily high of 135.36 on the European open. At time of writing, the pair is trading above 135.23, gaining 0.15% daily.
Thus, the yen pair rises for the third day in a row, while justifying the previous day’s upside break of the descending mid-July resistance line, which is now support around 134.00.
It also keeps buyers hopeful as it is the strongest bullish sign since late June.
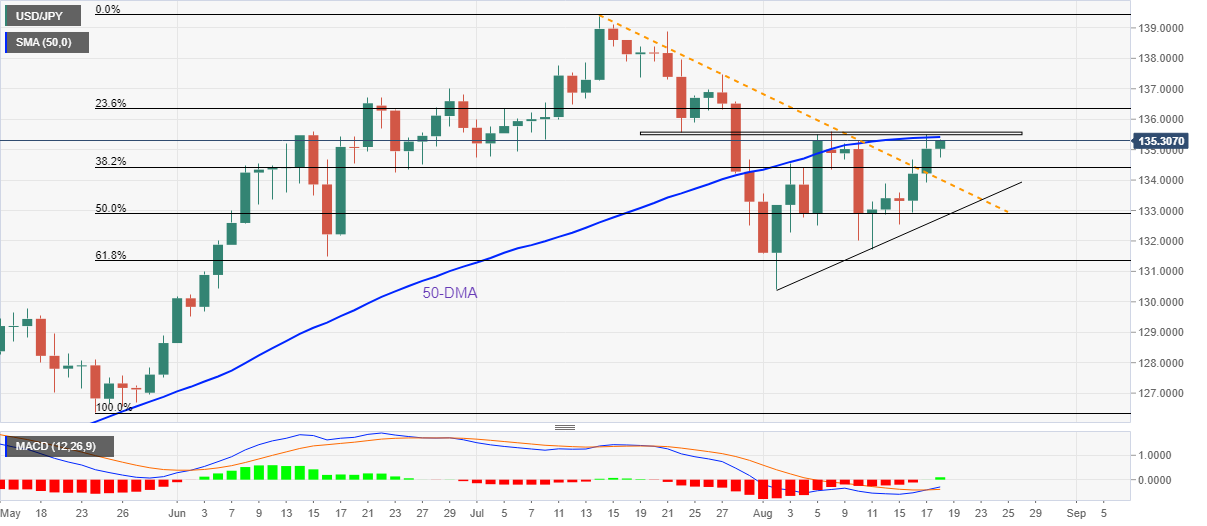
However, the 50 DMA and a horizontal zone comprising multiple levels marked since July 22, respectively around 135.40 and 135.50-55 look like a tough nut to crack for USD/JPY buyers.
After that, a move north towards June’s monthly high near 137.00 is imminent.
If USD/JPY prices hold firm beyond 137.00, the yearly high noted in July around 139.40 will be in the spotlight.
On the other hand, retracement moves remain unimpressive until the resistance-turned-support line at 134.00 is breached.
Even so, the convergence of the rising trend line from two weeks ago and the 50% Fibonacci retracement level of the May-July high, close to 132.90-85 becomes crucial support to watchas its breakout will confirm the bearish ascending triangle chart pattern.
USD/JPY: Daily Chart
Trend: Expected to continue rising
Source: Fx Street
With 6 years of experience, I bring to the table captivating and informative writing in the world news category. My expertise covers a range of industries, including tourism, technology, forex and stocks. From brief social media posts to in-depth articles, I am dedicated to creating compelling content for various platforms.


