
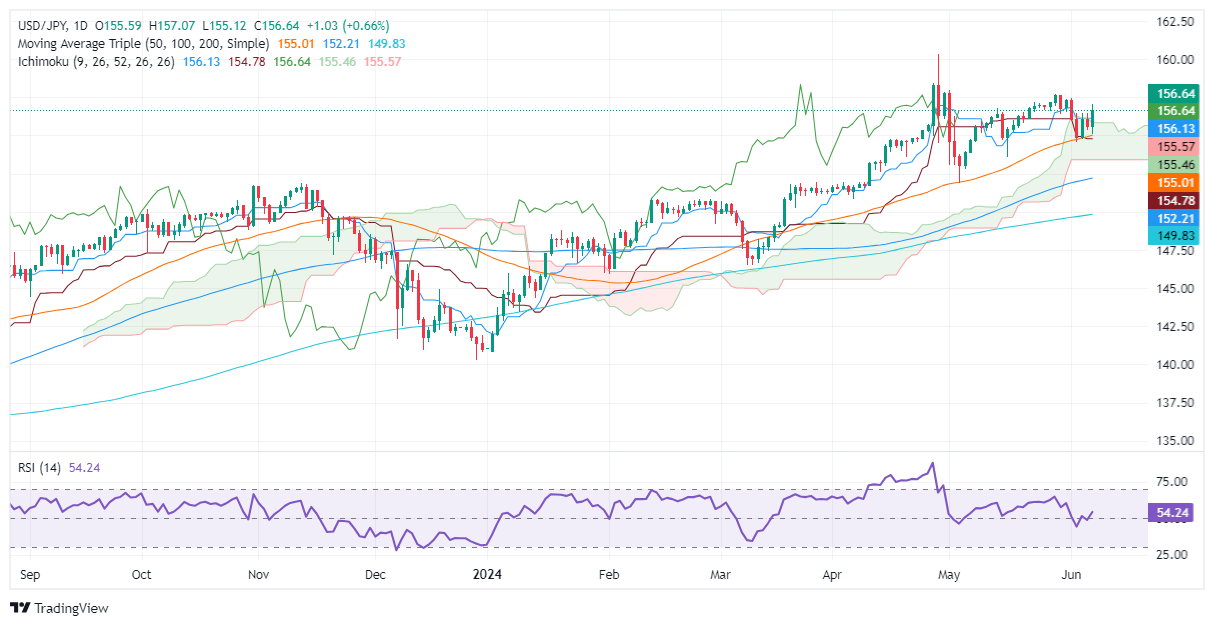
- USD/JPY rises above 156.50 as buyers push prices above the Ichimoku cloud.
- Resistance at June 4 high (156.48), 157.00, April 26 high (158.44), and yearly high (160.32).
- Supports at Senkou Span A and B (155.52/45), 50-DMA (154.98) and Ichimoku Cloud Base (153.40/50).
He USD/JPY posted modest gains of 0.66% on Friday after a stronger-than-expected U.S. jobs report, dimming the odds that the U.S. Federal Reserve could ease policy for the year. Therefore, the pair is trading at 156.64 after bouncing from lows of 155.12.
USD/JPY Price Analysis: Technical Perspective
From a daily chart perspective, USD/JPY continues to consolidate, tilted slightly higher. The pair rose above the Ichimoku (Kumo) cloud, an indication of the strength of the buyers.
Momentum turned bullish, but the pair could see an increase in volatility due to threats of intervention by Japanese authorities.
Once USD/JPY broke through the June 4 high of 156.48, that could support a move towards 157.00. With further strength, the next bid zone would be the April 26 high of 158.44, followed by the yearly high of 160.32.
Conversely, if USD/JPY falls below 156.00, the first support would be the confluence of Senkou Span A and B around 155.52/45, before testing the 50-day moving average (DMA) at 154.98. A break of the latter will expose the bottom of the Ichimoku (Kumo) cloud around 153.40/50.
USD/JPY Price Action – Daily Chart
Price of the Japanese Yen Today
The table below shows the percentage change of the Japanese Yen (JPY) against the major currencies listed today. The Japanese Yen was the strongest against the New Zealand Dollar.
| USD | EUR | GBP | JPY | CAD | AUD | NZD | CHF | |
|---|---|---|---|---|---|---|---|---|
| USD | 0.82% | 0.53% | 0.67% | 0.62% | 1.27% | 1.47% | 0.81% | |
| EUR | -0.82% | -0.27% | -0.14% | -0.19% | 0.46% | 0.72% | 0.01% | |
| GBP | -0.53% | 0.27% | 0.14% | 0.08% | 0.74% | 0.99% | 0.27% | |
| JPY | -0.67% | 0.14% | -0.14% | -0.05% | 0.59% | 0.81% | 0.15% | |
| CAD | -0.62% | 0.19% | -0.08% | 0.05% | 0.65% | 0.92% | 0.19% | |
| AUD | -1.27% | -0.46% | -0.74% | -0.59% | -0.65% | 0.25% | -0.48% | |
| NZD | -1.47% | -0.72% | -0.99% | -0.81% | -0.92% | -0.25% | -0.71% | |
| CHF | -0.81% | -0.01% | -0.27% | -0.15% | -0.19% | 0.48% | 0.71% |
The heat map shows the percentage changes of the major currencies against each other. The base currency is chosen from the left column, while the quote currency is chosen from the top row. For example, if you choose the Japanese Yen from the left column and move along the horizontal line to the US Dollar, the percentage change shown in the box will represent JPY (base)/USD (quote).
Source: Fx Street
I am Joshua Winder, a senior-level journalist and editor at World Stock Market. I specialize in covering news related to the stock market and economic trends. With more than 8 years of experience in this field, I have become an expert in financial reporting.


%20Luca%20Delpia%20-%20Archivio%20della%20Fondazione%20I%20Teatri%20Reggio%20Emilia%201071%20b%20(002).jpg "The CCCP on stage in Legnano for the last call: “If you weren’t there, we would not be here”")


