
- USD/JPY could be on the verge of a bullish breakout.
- The bears have given way to the bulls on the daily chart.
The USD/JPY is creating a bullish scenario on both the hourly and daily charts, and what follows illustrates the potential for a bullish breakout and bullish daily extension for the next few days.
USD/JPY H1 chart
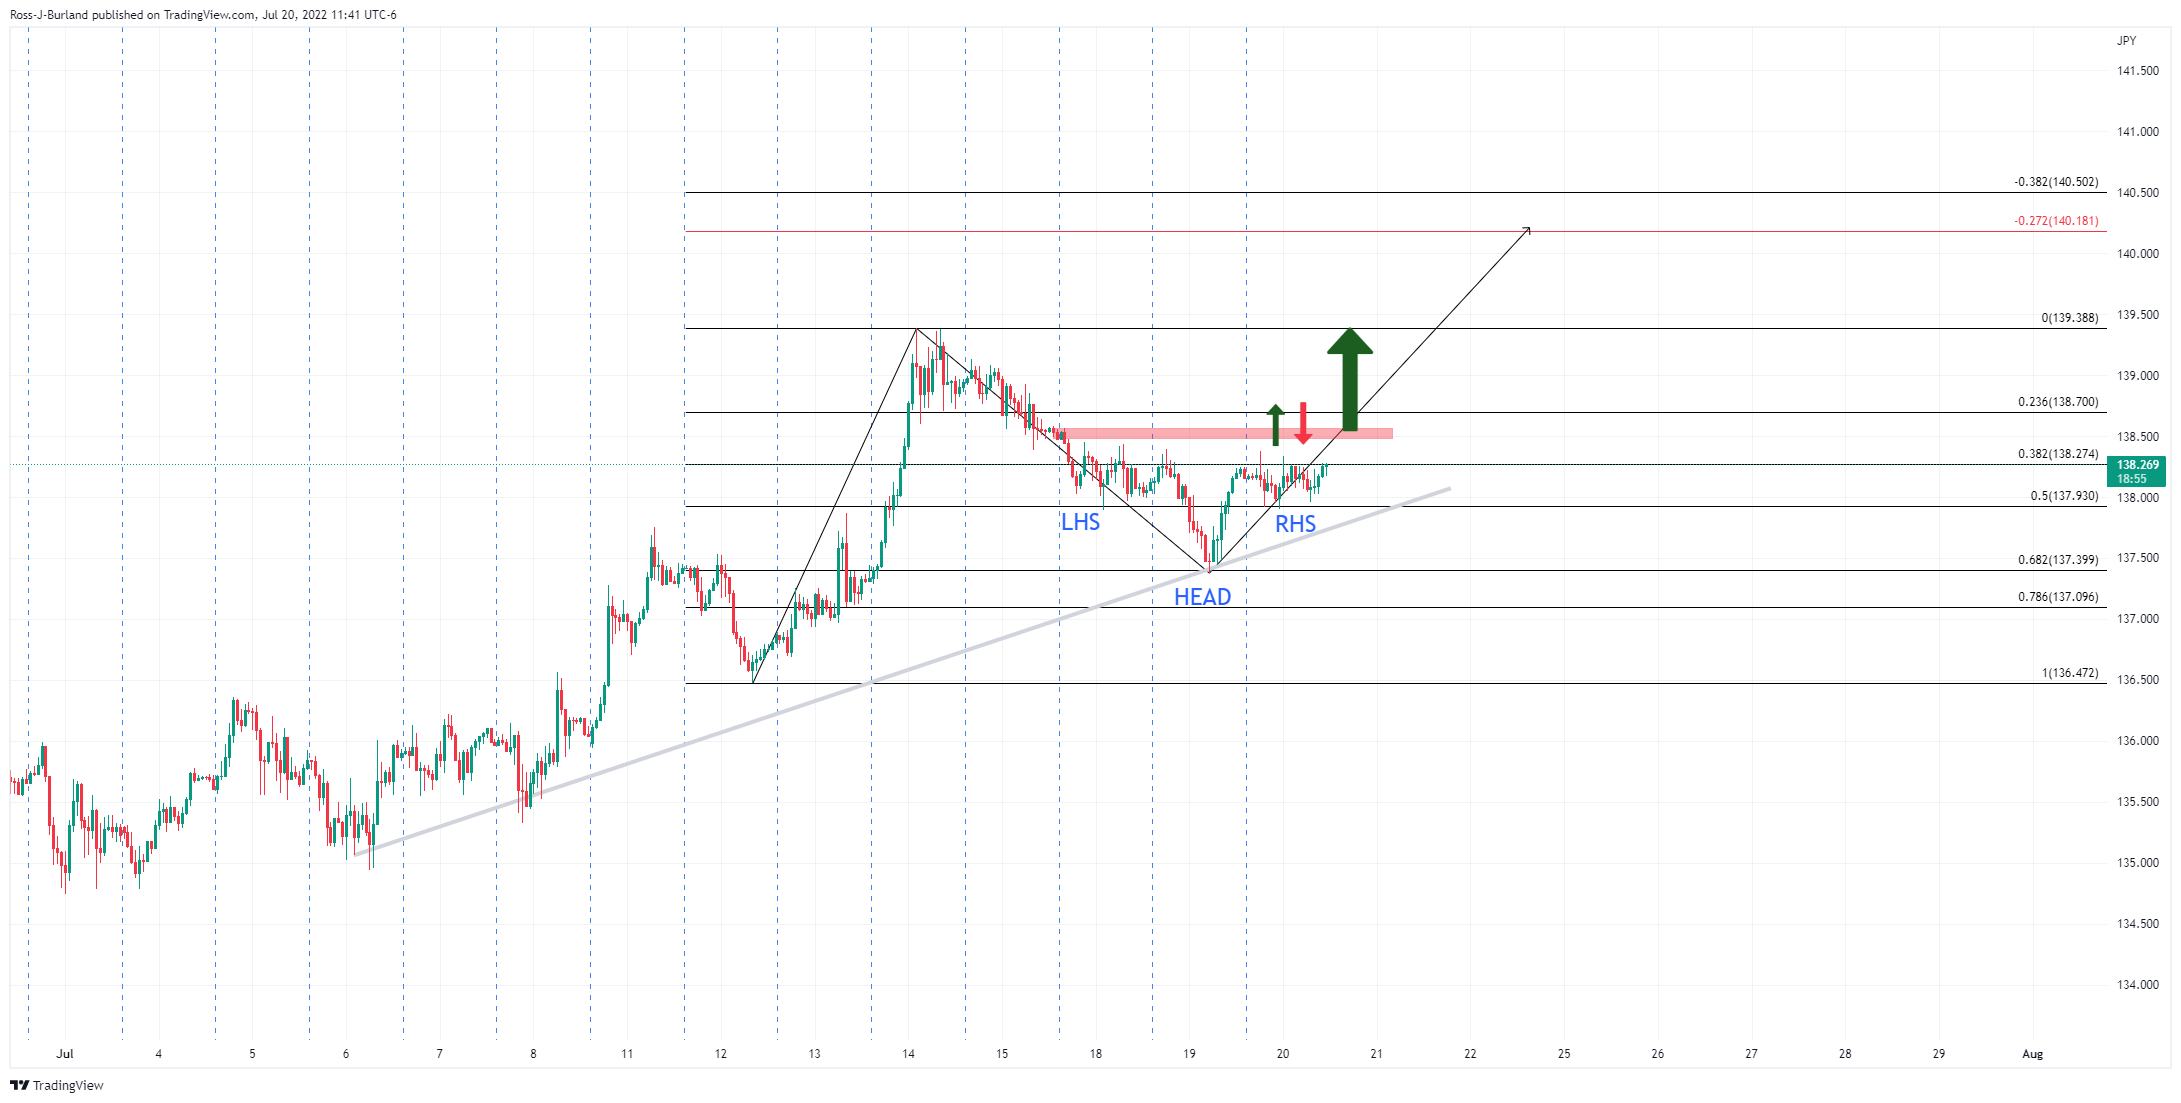
From an hourly perspective, the USD/JPY is forming an inverse head and shoulder pattern. If it breaks above the neckline around 138.50 and at what is presumed to be an interest level, as this area acted as the last top before the continuation of the sell off, the upside will be favourable. If this zone holds as support on early tests, then a daily extension could come into play:
USD/JPY daily chart
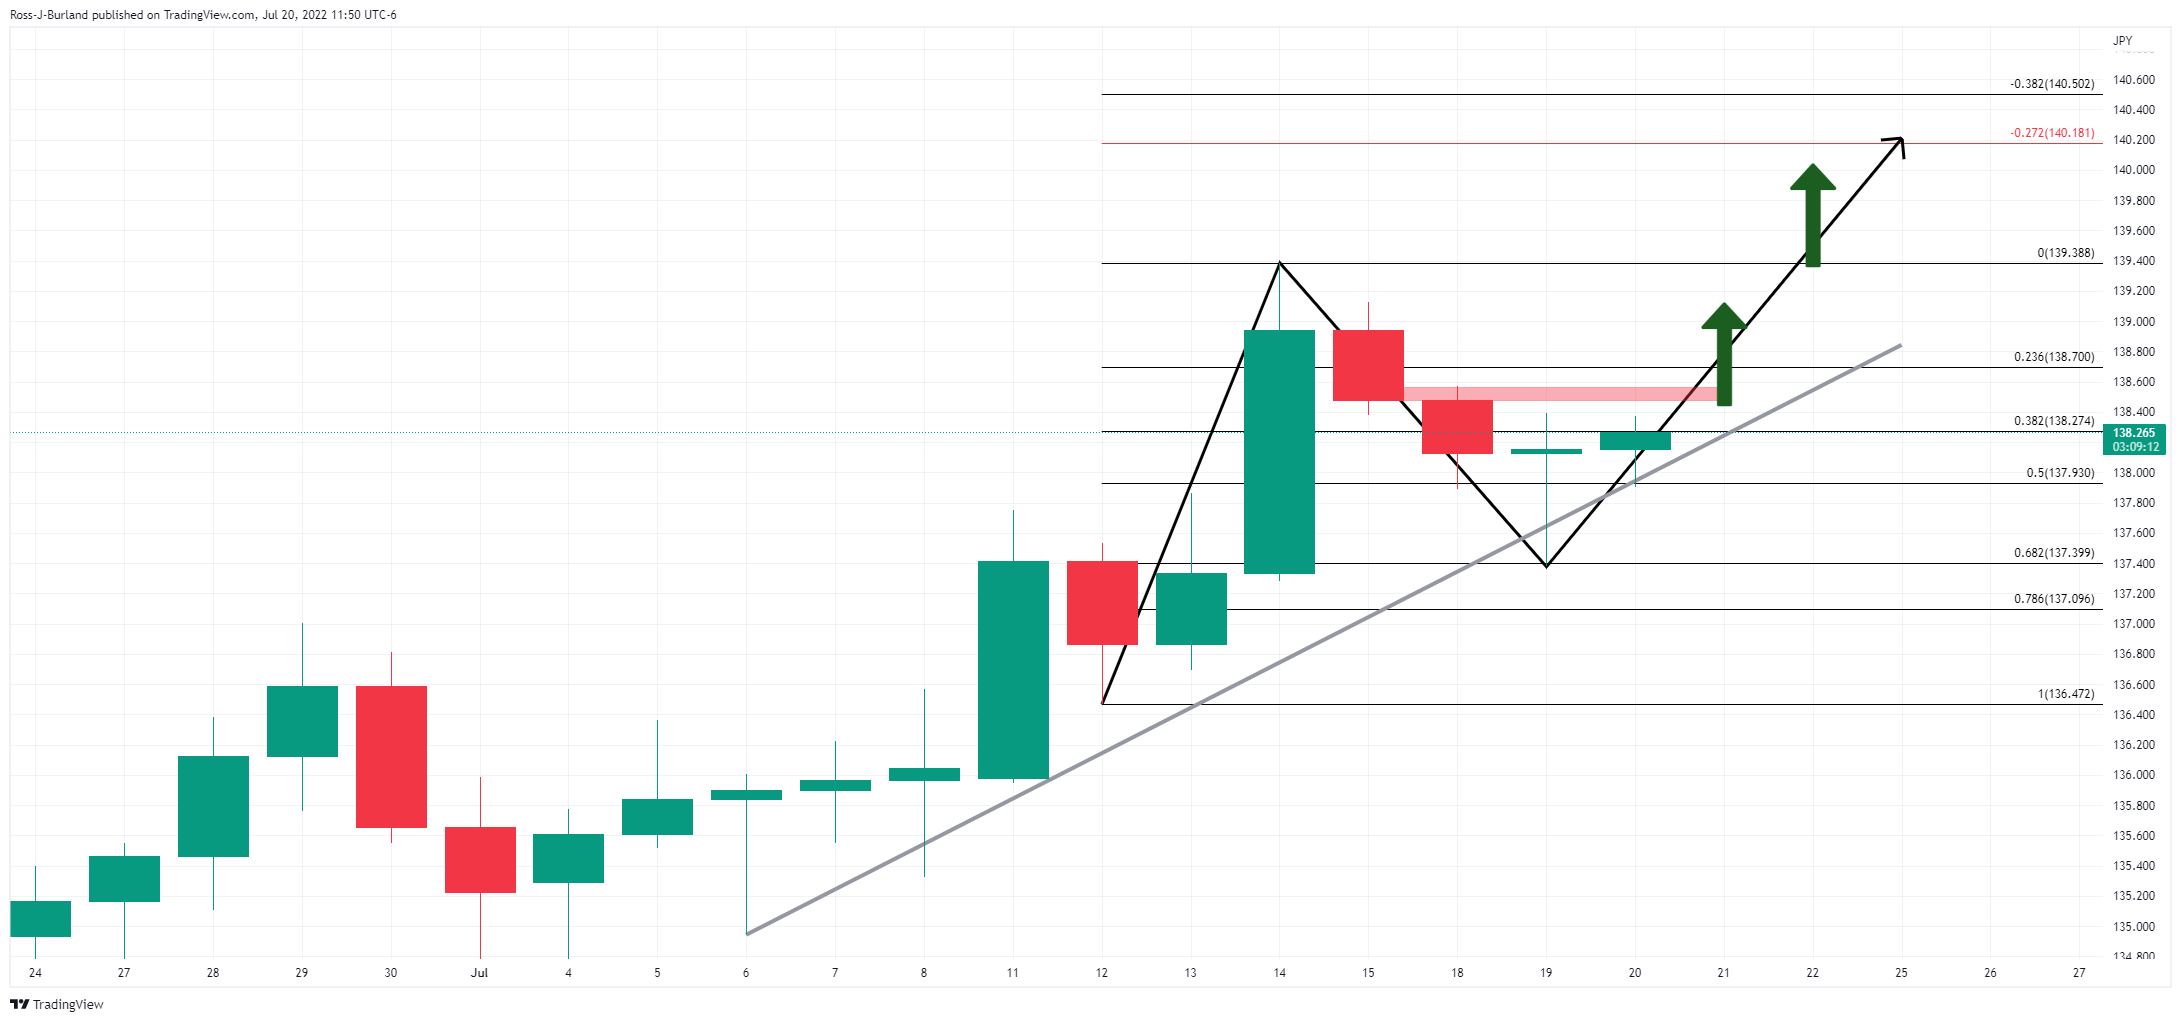
As illustrated, the daily chart has corrected to the 61.8% Fibonacci zone which has a confluence with the previous highs. This could be critical support for the pair and if the hourly chart’s bullish scenario plays out, then the bulls will be in the running for a significant move higher, potentially charting a new daily extension of the bullish cycle.
Source: Fx Street
With 6 years of experience, I bring to the table captivating and informative writing in the world news category. My expertise covers a range of industries, including tourism, technology, forex and stocks. From brief social media posts to in-depth articles, I am dedicated to creating compelling content for various platforms.


