
- USD/JPY will end the week with gains of 0.25%.
- From a daily chart point of view, USD/JPY is trading sideways as Japanese intervention in the FX markets looms.
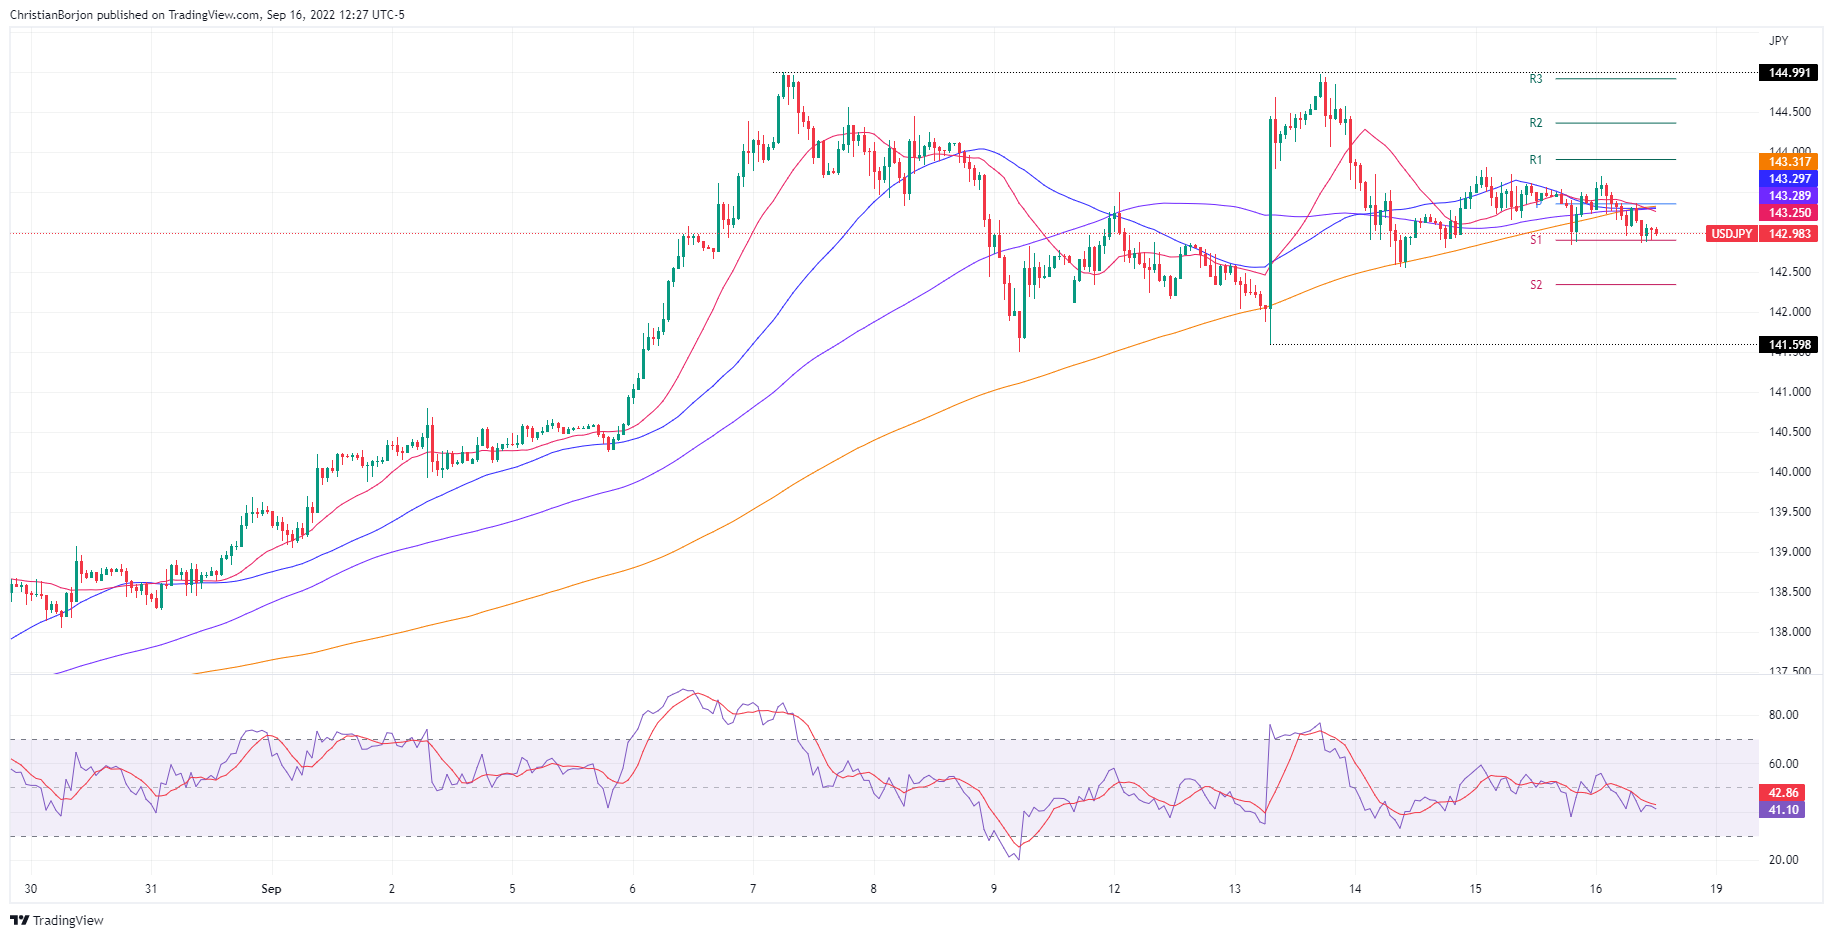
- In the short term, USD/JPY has a neutral bias to the downside, but a break below 143.00 could pave the way for 141.59.
The USD/JPY falls for the second day of the week, after failing to test the year’s high of 144.99, but fears of Japanese intervention in currency markets to strengthen the yen kept dollar buyers at bay, while the higher fell towards the 143.00 level. USD/JPY is trading at 142.98 after hitting a daily high at 143.69, down 0.30%.
USD/JPY Price Analysis: Technical Outlook
The USD/JPY daily chart shows the pair consolidating in the 140.00-144.99 zone for the past two weeks. USD/JPY price action is overextended to the upside, while the Relative Strength Index, broke out of overbought conditions and crossed below the 7-day SMA of the RSI, which means sellers are beginning to gain momentum. . However, if USD/JPY sellers want to regain control, they need a decisive break below the 20-day EMA at 140.64.
In the short term, the hourly chart of USD/JPY shows a neutral bias to the downside. Notably, the major currency, once dipping below the 144.00 figure on September 14, remained below the 143.50 area, trading sideways in the 143.00/50 range. Oscillators are pointing lower in bearish territory, which suggests that selling pressure is building in the pair.
If USD/JPY falls below 143.00, the next support would be the daily S2 pivot at 142.33. Once broken, the next demand zone would be the psychological level of 142.00, before the weekly low reached on September 13 at 141.59.
Key USD/JPY Technical Levels
Source: Fx Street
With 6 years of experience, I bring to the table captivating and informative writing in the world news category. My expertise covers a range of industries, including tourism, technology, forex and stocks. From brief social media posts to in-depth articles, I am dedicated to creating compelling content for various platforms.


