
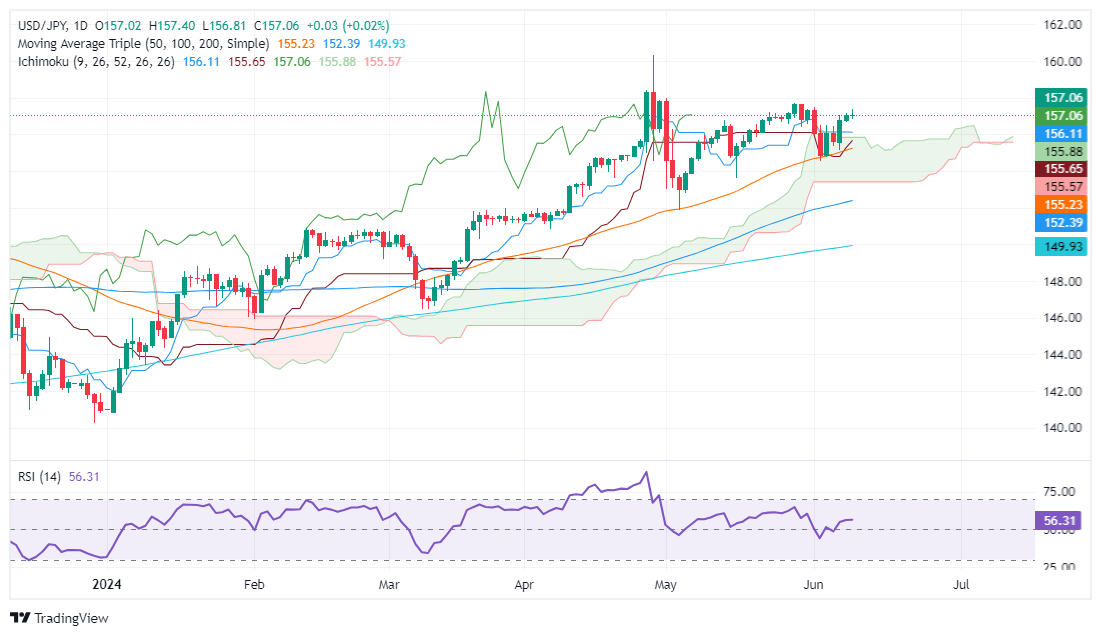
- The USD/JPY is trading virtually unchanged but below its opening price.
- Momentum begins to shift in favor of sellers, but they must recover key support levels.
- If buyers reclaim 157.00 and 157.71, that could pave the way to test the yearly highs.
He USD/JPY declines during the North American session but is largely unchanged as traders prepare for a busy economic schedule on Wednesday, including May US Consumer Price Index (CPI) data and the US monetary policy decision. Federal Open Market Committee (FOMC). The pair is trading at 156.94, down around 0.06%.
USD/JPY Price Analysis: Technical Perspective
USD/JPY daily chart suggests buyers are losing strength; After hitting a weekly high of 157.40, they failed to sustain gains above 157.00. Momentum is also fading as the RSI remains bullish but points downward.
If USD/JPY extends its decline below the current weekly low of 156.64, the next stop would be the Senkou Span A at 155.88. Further losses are expected at the Senkou Span B at 155.65, followed by the 50-day moving average (DMA) at 155.22.
Conversely, if USD/JPY buyers push the exchange rate above 157.00, the next resistance would be the May 29 high at 157.71. Once broken, the next stop would be the April 26 high at 158.44 before challenging the yearly high of 158.44.
USD/JPY Price Action – Daily Chart
PRICE of the Japanese Yen Today
The table below shows the percentage change of the Japanese Yen (JPY) against the major currencies listed today. The Japanese Yen was the strongest against the Euro.
| USD | EUR | GBP | JPY | CAD | AUD | NZD | CHF | |
|---|---|---|---|---|---|---|---|---|
| USD | 0.19% | -0.12% | 0.00% | -0.05% | 0.01% | -0.30% | 0.11% | |
| EUR | -0.19% | -0.31% | -0.19% | -0.23% | -0.16% | -0.48% | -0.08% | |
| GBP | 0.12% | 0.31% | 0.12% | 0.07% | 0.13% | -0.18% | 0.19% | |
| JPY | 0.00% | 0.19% | -0.12% | -0.03% | 0.00% | -0.30% | 0.08% | |
| CAD | 0.05% | 0.23% | -0.07% | 0.03% | 0.06% | -0.26% | 0.12% | |
| AUD | -0.01% | 0.16% | -0.13% | -0.01% | -0.06% | -0.32% | 0.05% | |
| NZD | 0.30% | 0.48% | 0.18% | 0.30% | 0.26% | 0.32% | 0.38% | |
| CHF | -0.11% | 0.08% | -0.19% | -0.08% | -0.12% | -0.05% | -0.38% |
The heat map shows the percentage changes of the major currencies against each other. The base currency is chosen from the left column, while the quote currency is chosen from the top row. For example, if you choose the Japanese Yen from the left column and move along the horizontal line to the US Dollar, the percentage change shown in the box will represent JPY (base)/USD (quote).
Source: Fx Street
I am Joshua Winder, a senior-level journalist and editor at World Stock Market. I specialize in covering news related to the stock market and economic trends. With more than 8 years of experience in this field, I have become an expert in financial reporting.


