
- USD/JPY is hovering around Tuesday’s open, above 144.70.
- The major pair is still bullish, but it is getting closer to the 20-day EMA, which, once breached, could pave the way for the downside.
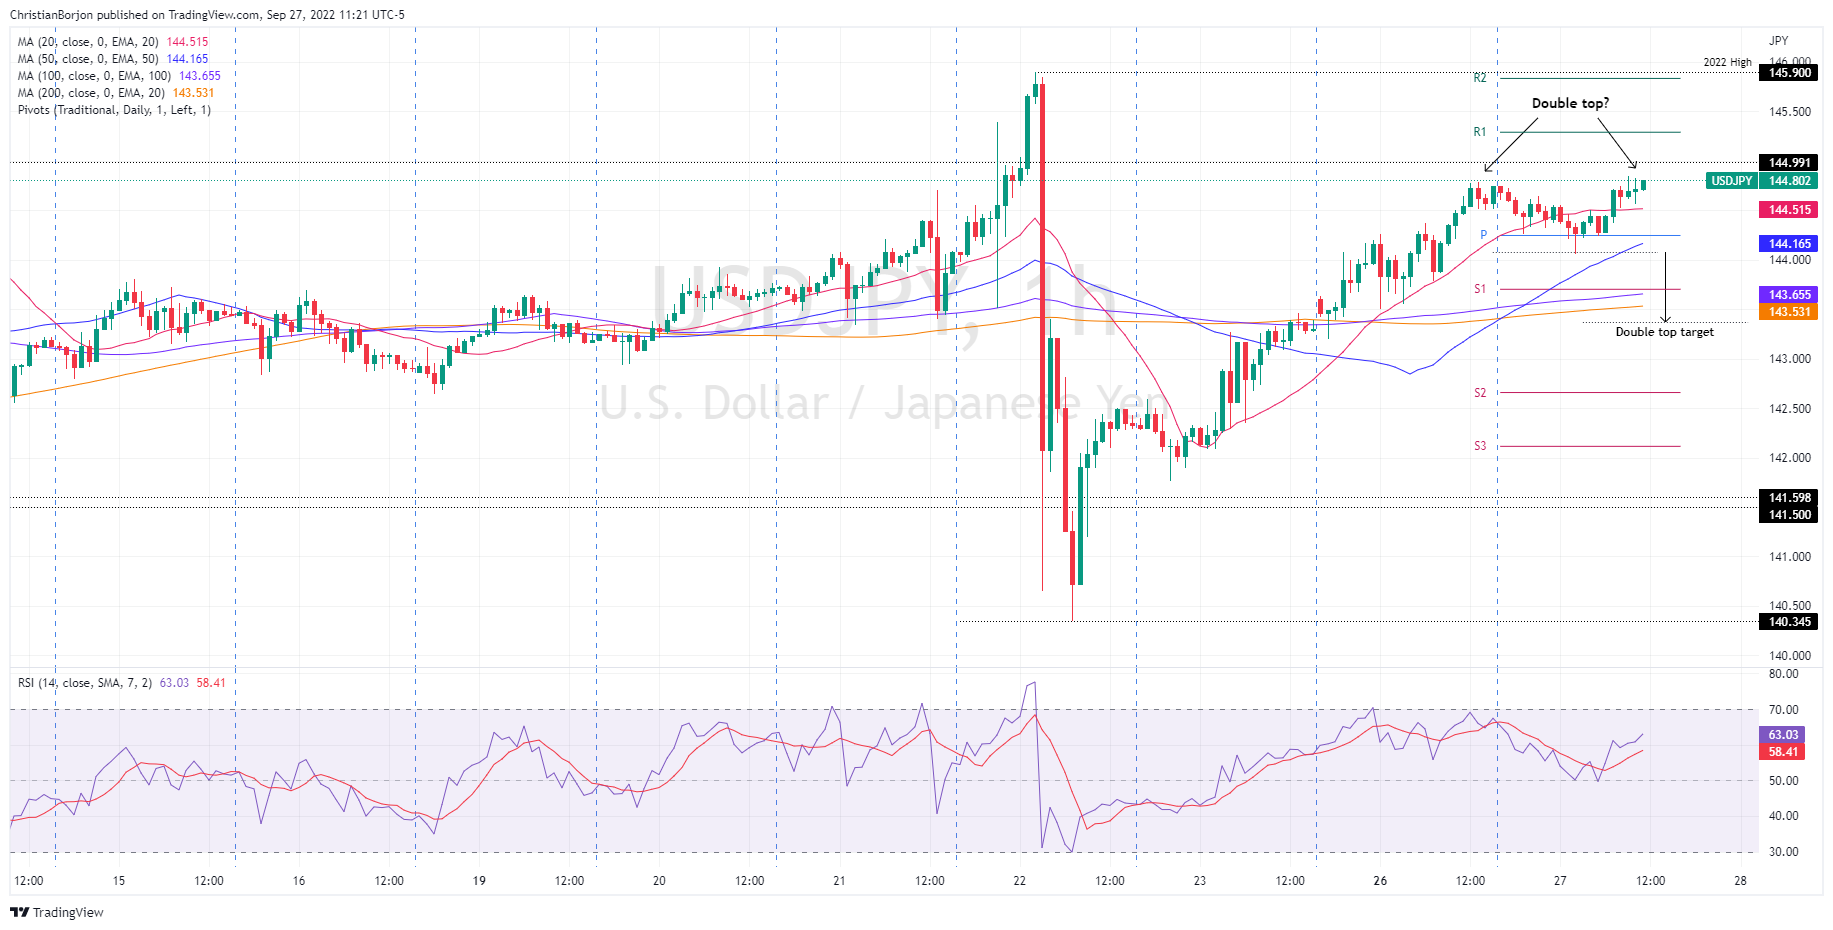
- In the short term, USD/JPY is biased to the downside as a double top has emerged on the 1 hour chart.
The USD/JPY fluctuates around week’s high at 144.78, amid a boost in risk appetite, as evidenced by US stocks holding decent gains after the sell-off of the past two trading sessions, courtesy of upbeat sentiment . At the time of writing, USD/JPY is trading at 144.80, almost unchanged.
USD/JPY Price Analysis: Technical Outlook
USD/JPY is in a borderline range of 142.00-145.00 after last week’s intervention. Even though the majors still have a bullish bias, and the 20 day EMA is closing in on price action, meaning a break below the latter would put downward pressure on the pair in the short term .
In the short term, the USD/JPY one hour chart shows the emergence of a double top chart pattern around the 144.60-75 area, which could pave the way for further losses. However, the 20 EMA and the 50 EMA, which meanders around 144.51 and 144.16, respectively, would be difficult to beat. But once broken, a drop to the daily S1 pivot around 143.70 is anticipated.
On the other hand, the first resistance for USD/JPY would be the 145.00 figure, the line in the sand imposed by the Bank of Japan intervention last week. Breaking above will expose the year’s high at 145.90, ahead of the 146.00 figure.
Key USD/JPY Technical Levels
Source: Fx Street
With 6 years of experience, I bring to the table captivating and informative writing in the world news category. My expertise covers a range of industries, including tourism, technology, forex and stocks. From brief social media posts to in-depth articles, I am dedicated to creating compelling content for various platforms.


