
- In the longer term, USD/JPY has a neutral to bullish bias, facing strong resistance at 135.50.
- The USD/JPY hourly chart shows a tight 40-point trading range ahead of Wednesday’s US CPI report.
The USD/JPY it is almost sideways amid a calm American session ahead of the July US inflation report, which could shed light on further Fed tightening at the September meeting. At the time of writing, USD/JPY is trading at 135.12, slightly up 0.14%.
USD/JPY Price Analysis: Technical Outlook
The USD/JPY daily chart shows the pair with a neutral to bullish bias. Over the past two days, the pair’s price action has faced solid resistance around the 135.50 area, capping USD/JPY, while the Relative Strength Index (RSI) at 50.32 illustrates the consolidation of the pair.
If USD/JPY breaks above 135.50, the next resistance would be the 20-day EMA at 135.83. Once broken, the next resistance would be the July 28 high at 136.57, followed by 137.00. On the other hand, the first support for the USD/JPY would be the 50-day EMA at 135.12. If it breaks below, the 135.00 figure will be exposed, followed by the 5th Aug daily low at 132.52.
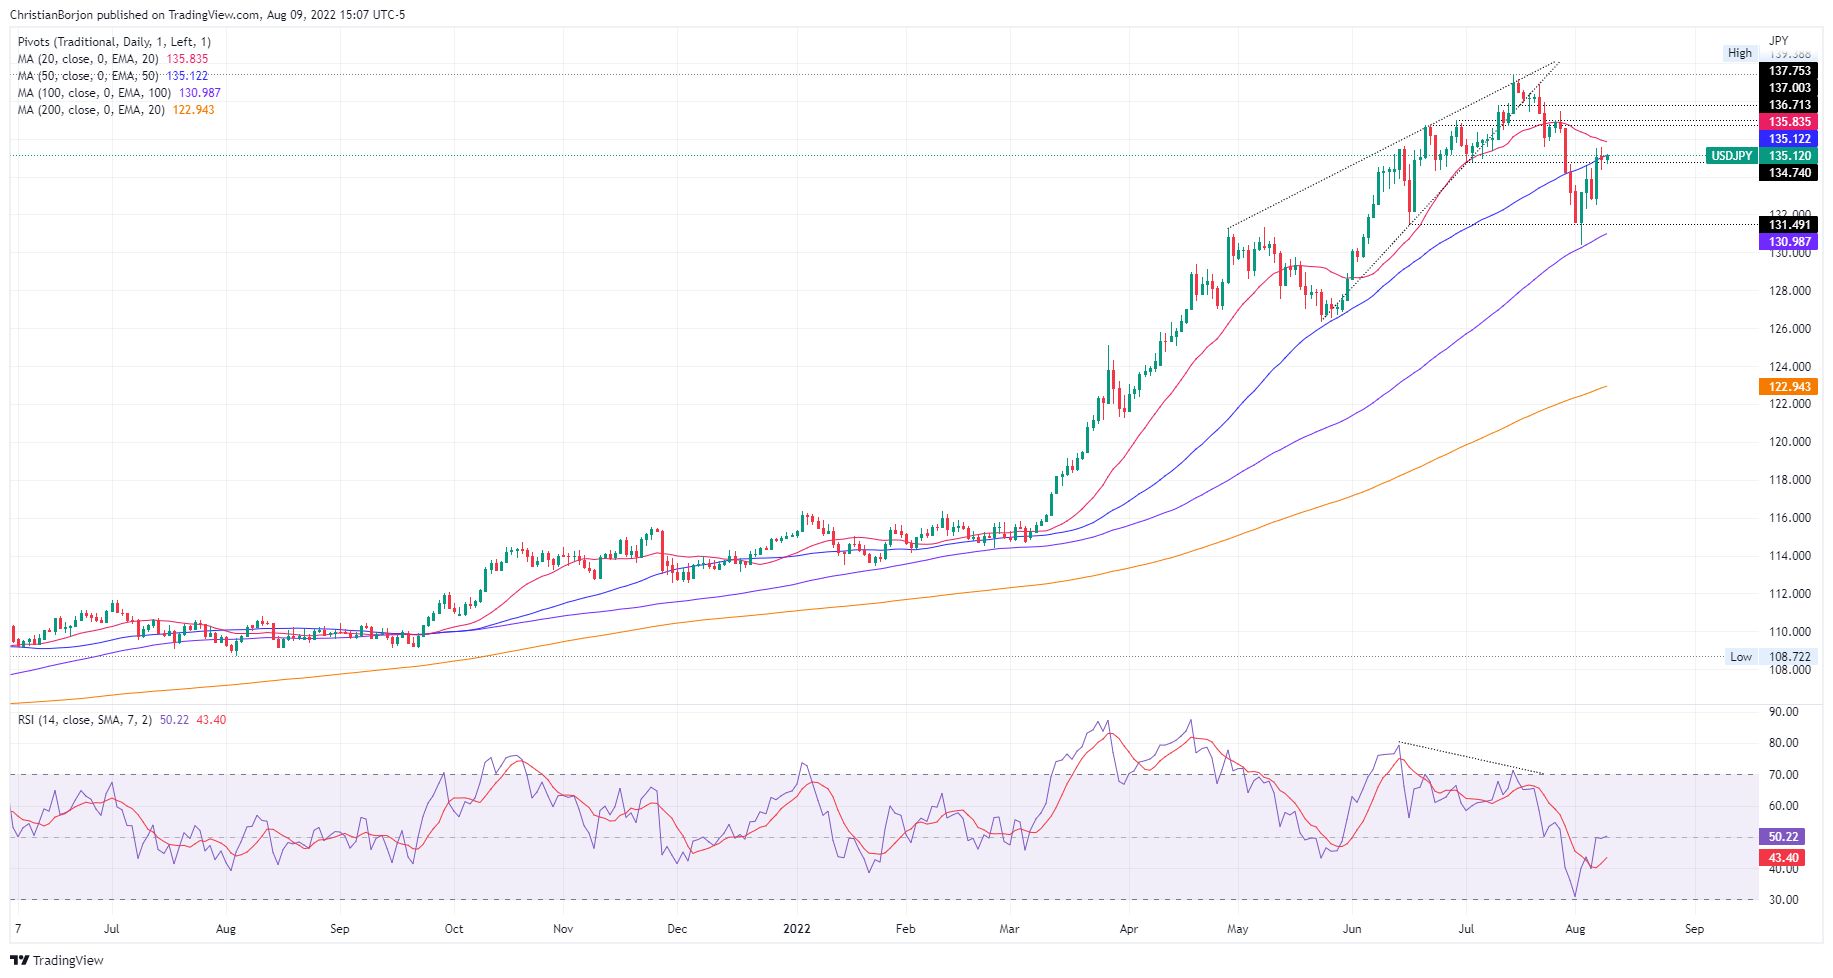
USD/JPY daily chart
From a short term perspective, the USD/JPY one hour chart illustrates the tight 40 pip range of Tuesday’s price action. The 20 and 50 hourly EMAs around the 134.95-97 area support the above, indicating that USD/JPY traders remain awaiting further US economic data, specifically inflation. Therefore, a break above/below that range would determine the move of the pair.
To the upside, the first resistance for USD/JPY would be the 135.50 level. A break of the latter would expose the daily high of July 27 at 136.58, followed by 137.00. To the downside, the first support for USD/JPY will be the daily low of August 8 at 134.75. Once broken, the next support will be the 200 hourly EMA at 133.57.
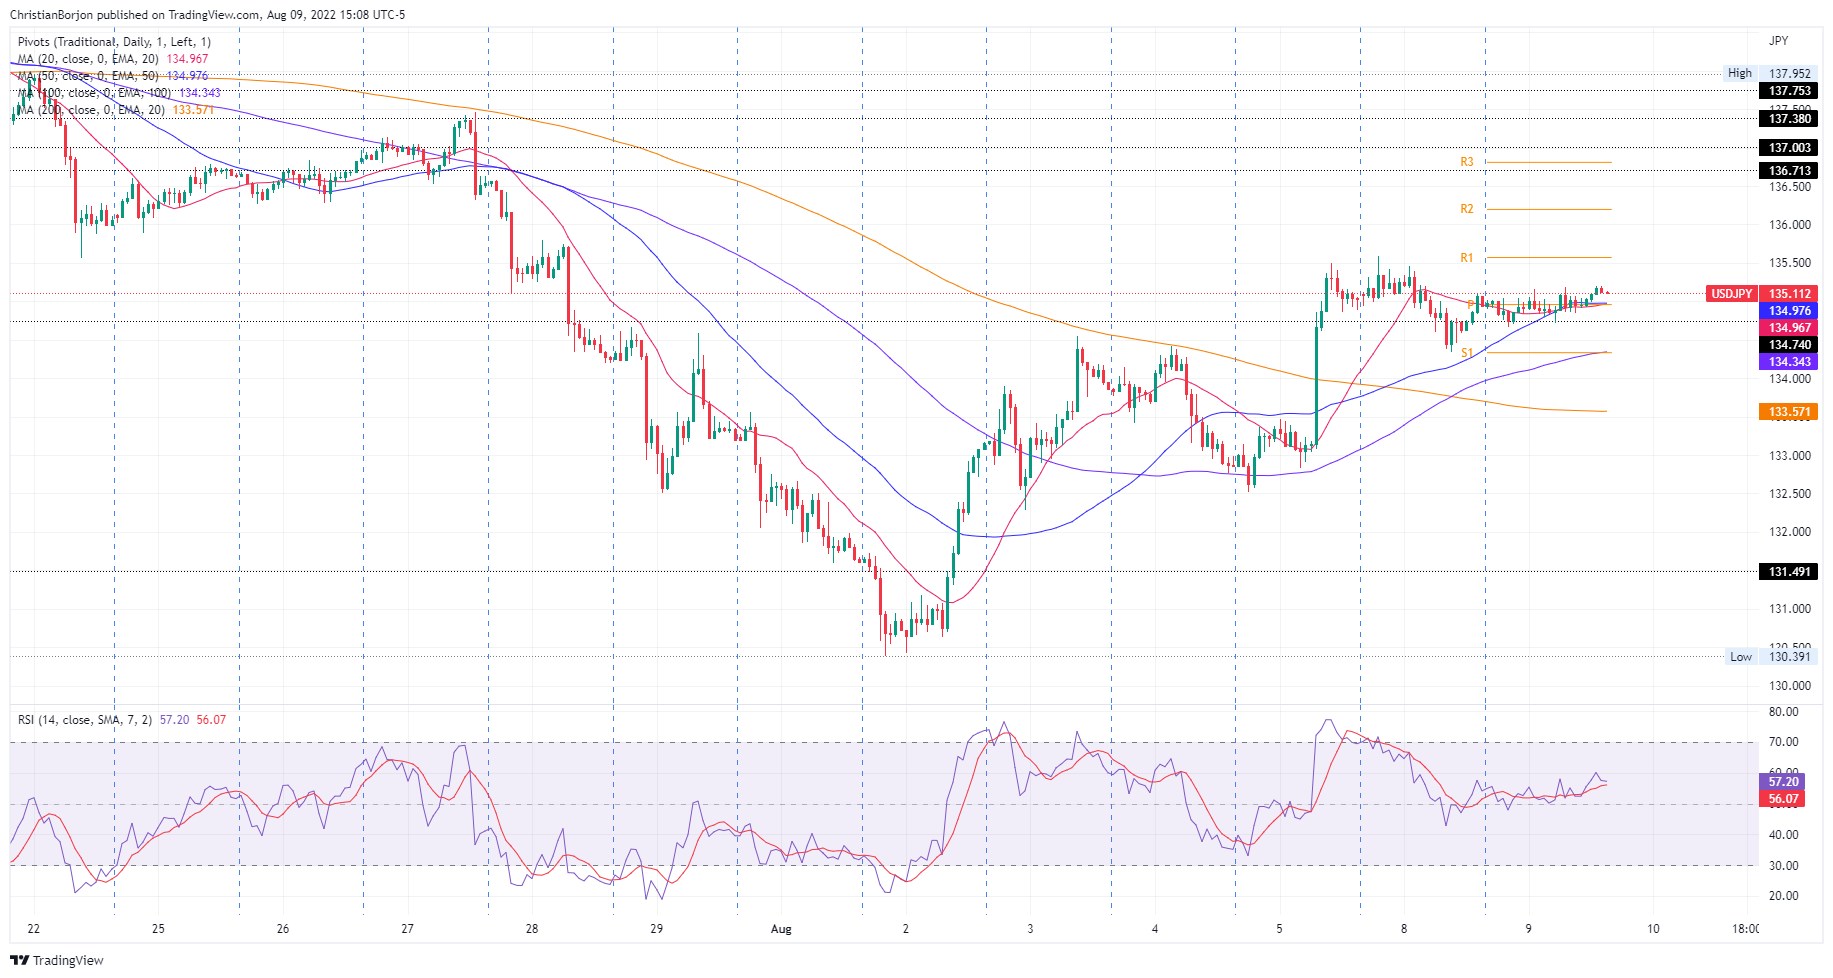
USD/JPY hourly chart
Technical levels
Source: Fx Street
With 6 years of experience, I bring to the table captivating and informative writing in the world news category. My expertise covers a range of industries, including tourism, technology, forex and stocks. From brief social media posts to in-depth articles, I am dedicated to creating compelling content for various platforms.


