
- USD/JPY pared some of its Asian session gains courtesy of the Bank of Japan’s decision.
- USD/JPY Price Analysis: The failure to conquer the 20-day EMA compounded a drop of more than 200 points below 128.50.
The USD/JPY is holding on to gains after hitting a daily high of 131.57 following the release of the Bank of Japan’s monetary policy decision, which triggered a 400-point rally. However, throughout the North American session, the Japanese yen (JPY) is staging a comeback against its counterpart, the US dollar (USD), and is currently down 0.24%. At the time of writing, the USD/JPY pair is trading at 128.56.
USD/JPY Price Analysis: Technical Perspective
On the daily chart of USD/JPY, the major currencies tested the confluence of the 20-day EMA and the daily high at 131.37, and failed to sustain the uptrend. Also, on its way lower, USD/JPY pulled back below a four-month downtrend resistance line that passed around 130.30 and extended its downtrend below 129.00 towards current spot price.
However, oscillators such as the Relative Strength Index (RSI) although in bearish territory, are sloping to the upside which could mean a reversal could be in store. But the Rate of Change suggests that buyers are losing momentum as it pulls back to the level zero.
The path of least resistance in USD/JPY is skewed to the downside, although if USD/JPY makes a daily close above 128.46, that could open the door for further upside and could test 129.00. Otherwise, the first support for USD/JPY would be 128.00. Otherwise, the first support for USD/JPY would be 128.00. If this last level is broken, the May 24 low would be at 126.36, followed by the March 31 daily low of 121.27.
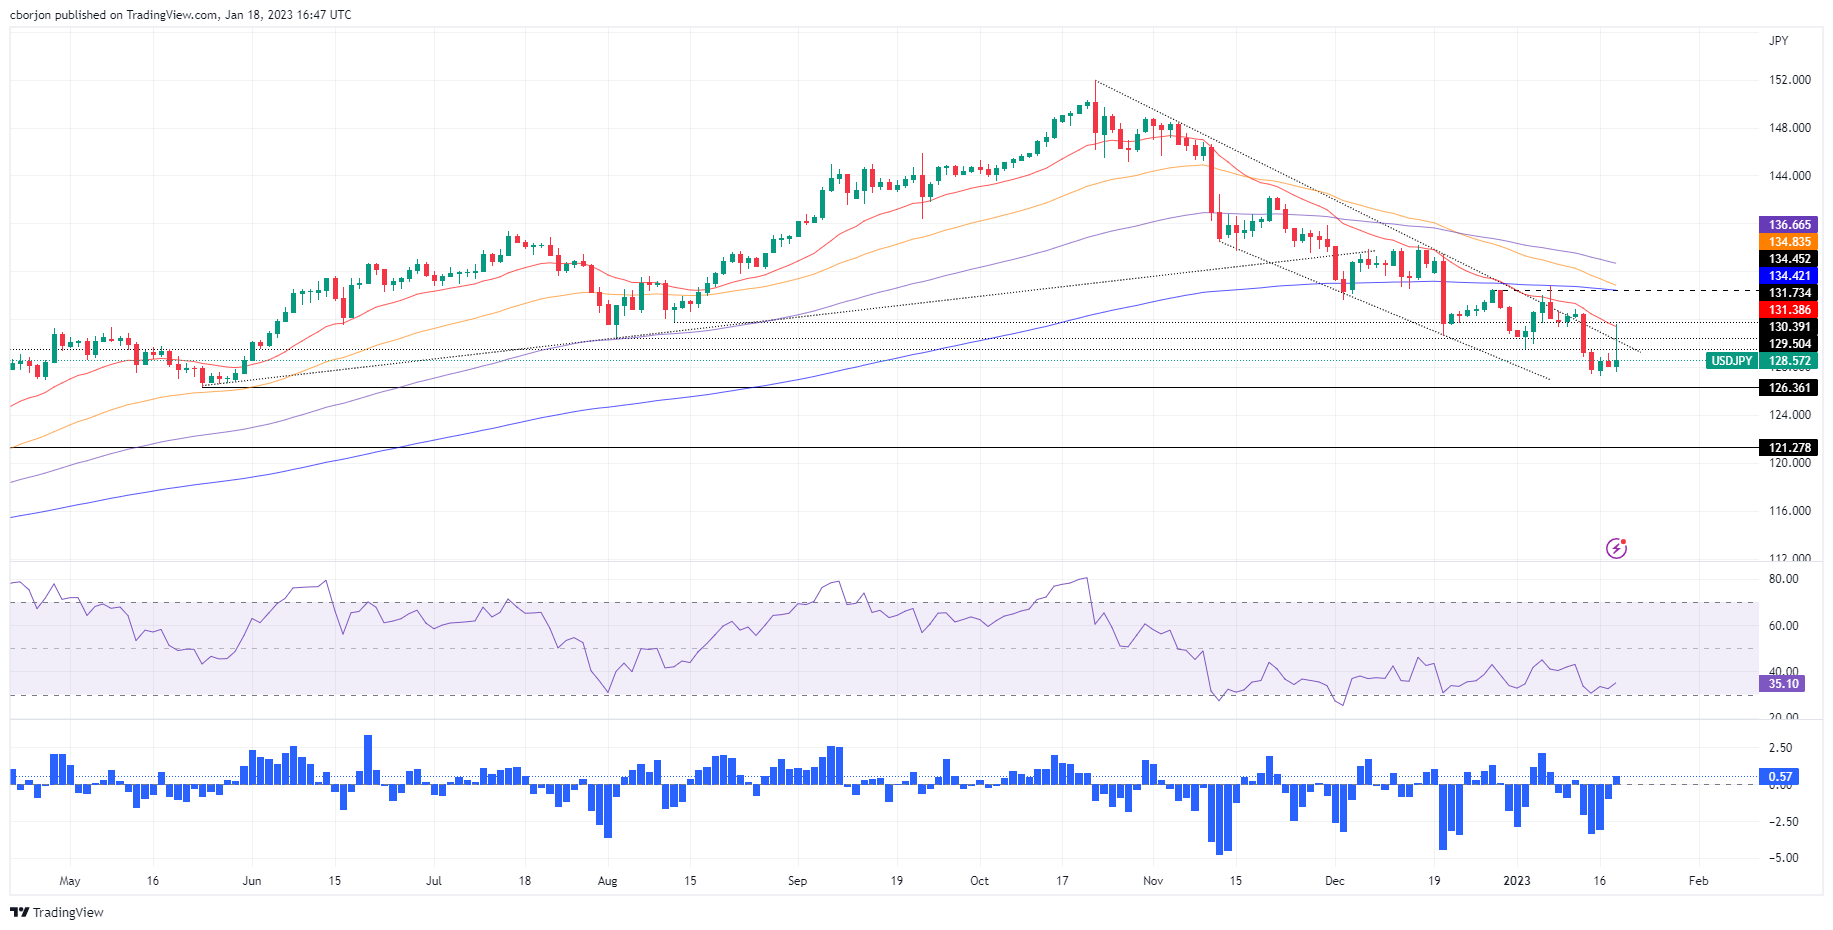
Key technical levels for USD/JPY
Source: Fx Street
I am Joshua Winder, a senior-level journalist and editor at World Stock Market. I specialize in covering news related to the stock market and economic trends. With more than 8 years of experience in this field, I have become an expert in financial reporting.


