
- The Japanese yen strengthened against the dollar amid a deteriorating environment.
- USD/JPY Price Analysis: Downtrend, but failure to recover to 137.50 could worsen recovery to 140.00.
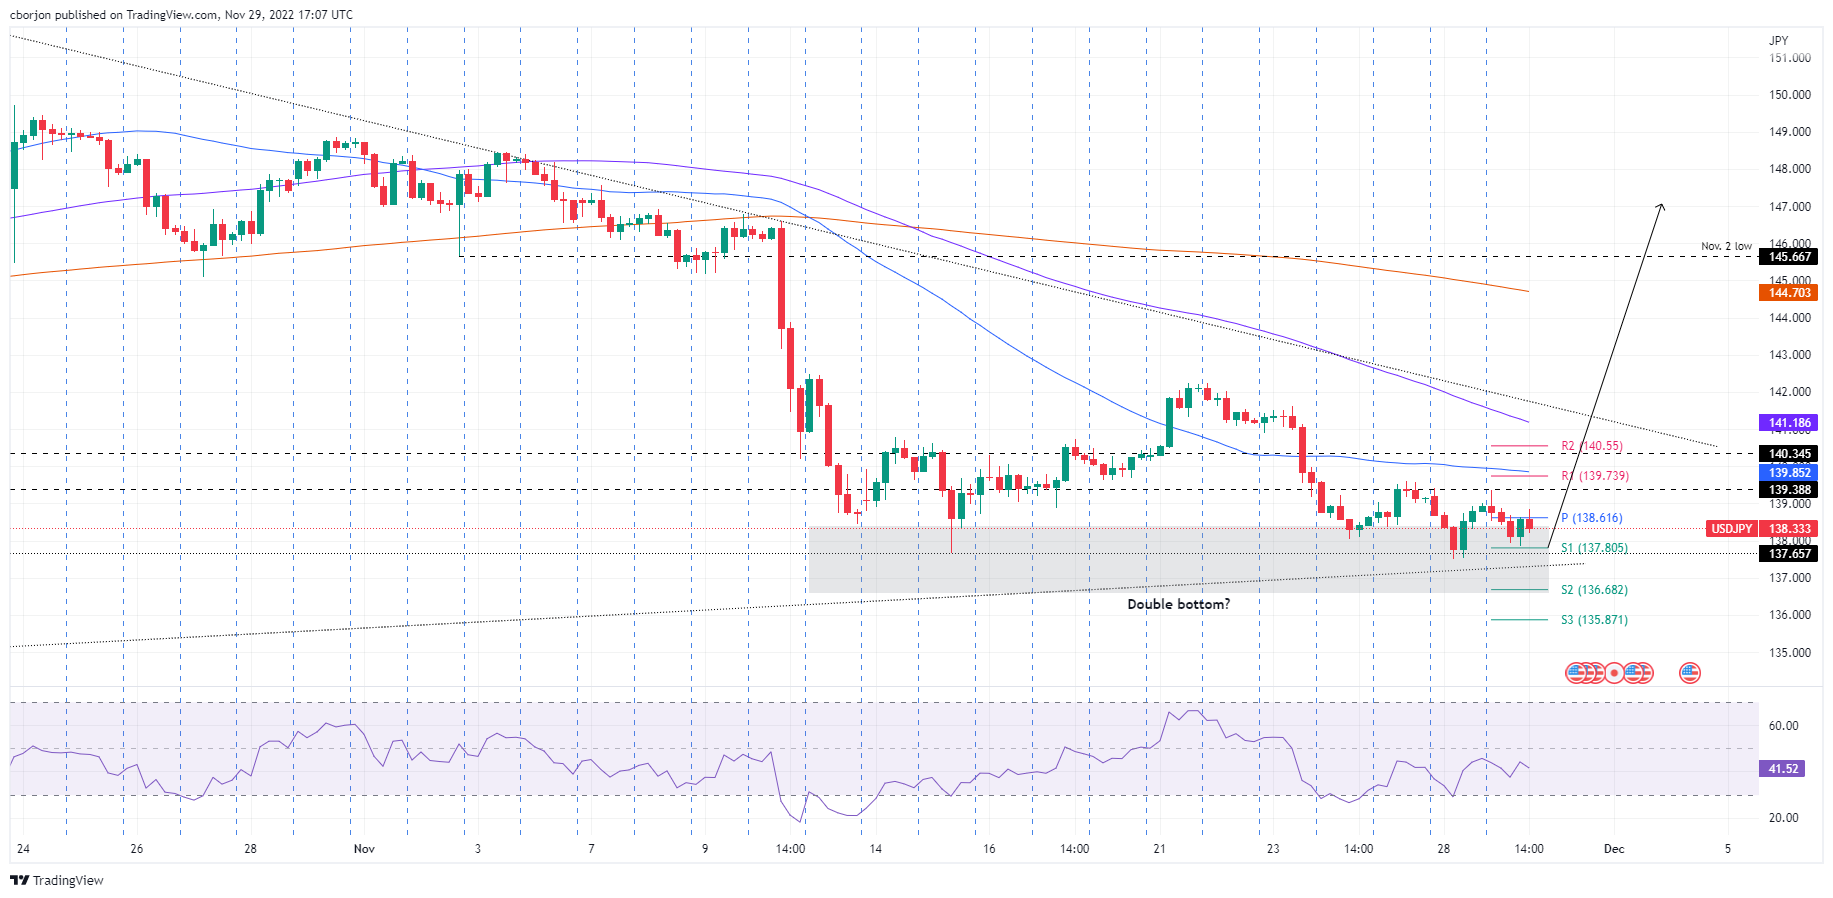
The US dollar (USD) falls against the Japanese yen (JPY) amid risk-off sentiment, as evidenced by US stocks trading in the red, while US Treasury yields rise and the USD it stays down. At the time of writing this article, the USD/JPY trades at 138.39 after hitting a daily high of 139.35.
USD/JPY Price Analysis: Technical Perspective
Following Monday’s price action that formed a hammer with an extended lower wick, USD/JPY posted moderate losses but remains above the key psychological level of 138.00. Notably, the slopes of the 50 and 100 day EMAs are flattening out, which means the pair is trendless, stuck in the 137.00-139.50 zone. Also, the Relative Strength Index (RSI) at 34.20 turned flat.
In the short term, the USD/JPY 4 hour chart is biased to the downside, trading below the ordered 50, 100 and 200 EMAs in a perfectly bearish fashion. USD/JPY is facing solid support at the daily S1 pivot point at 137.80. Note that a five-month uptrend line passes through 137.50 which, once broken, could open the door to the 137.00 figure, followed by the daily S2 pivot at 136.68 and the S3 pivot level at 135.87.
On the other hand, the first resistance for USD/JPY would be the daily pivot at 138.61. Breaking above will expose the confluence of the R1 daily pivot and the 50 EMA at 139.73/85, followed by the 140.00 psychological level, before the R3 daily pivot at 140.55.
Key USD/JPY Technical Levels
Source: Fx Street
I am Joshua Winder, a senior-level journalist and editor at World Stock Market. I specialize in covering news related to the stock market and economic trends. With more than 8 years of experience in this field, I have become an expert in financial reporting.


