
- The USD/JPY daily chart shows a bearish trend, although it is still unable to extend its losses below 128.00
- USD/JPY is trading sideways in the short term, waiting to break above/below 129.00/128.00.
On Thursday, USD/JPY fails to hold its gains and is trading below its opening price by 0.33% after hitting a daily high of 128.88. As of this writing, USD/JPY is trading at 128.40, amid risk aversion momentum and a soft US dollar (USD).
USD/JPY Price Analysis: Technical Perspective
Failing to break above the 20-day EMA at 131.13 left USD/JPY exposed to selling pressure. Additionally, the price action returned below a three-month-old downtrend line of resistance, which tracks USD/JPY downtrend. Therefore, the path of least resistance is to the downside, but a decisive break below the 127.21 low is needed, so USD/JPY could approach the May 24 daily low of 126.36.
In the short term, the 4-hour chart for USD/JPY suggests that the pair is range bound, although the Relative Strength Index (RSI) is in bearish territory. The Rate of Change (Rate) shows that buyers are gaining momentum. Therefore, the mixed signals surrounding the USD/JPY pair could deter traders from opening new positions unless a decisive breakout is achieved.
Key USD/JPY resistance levels are 129.00, the daily pivot at 129.33, and the 50 EMA at 129.60. On the other hand, the first support for USD/JPY would be 128.00, followed by the daily low of January 18 at 127.55, before 127.00.
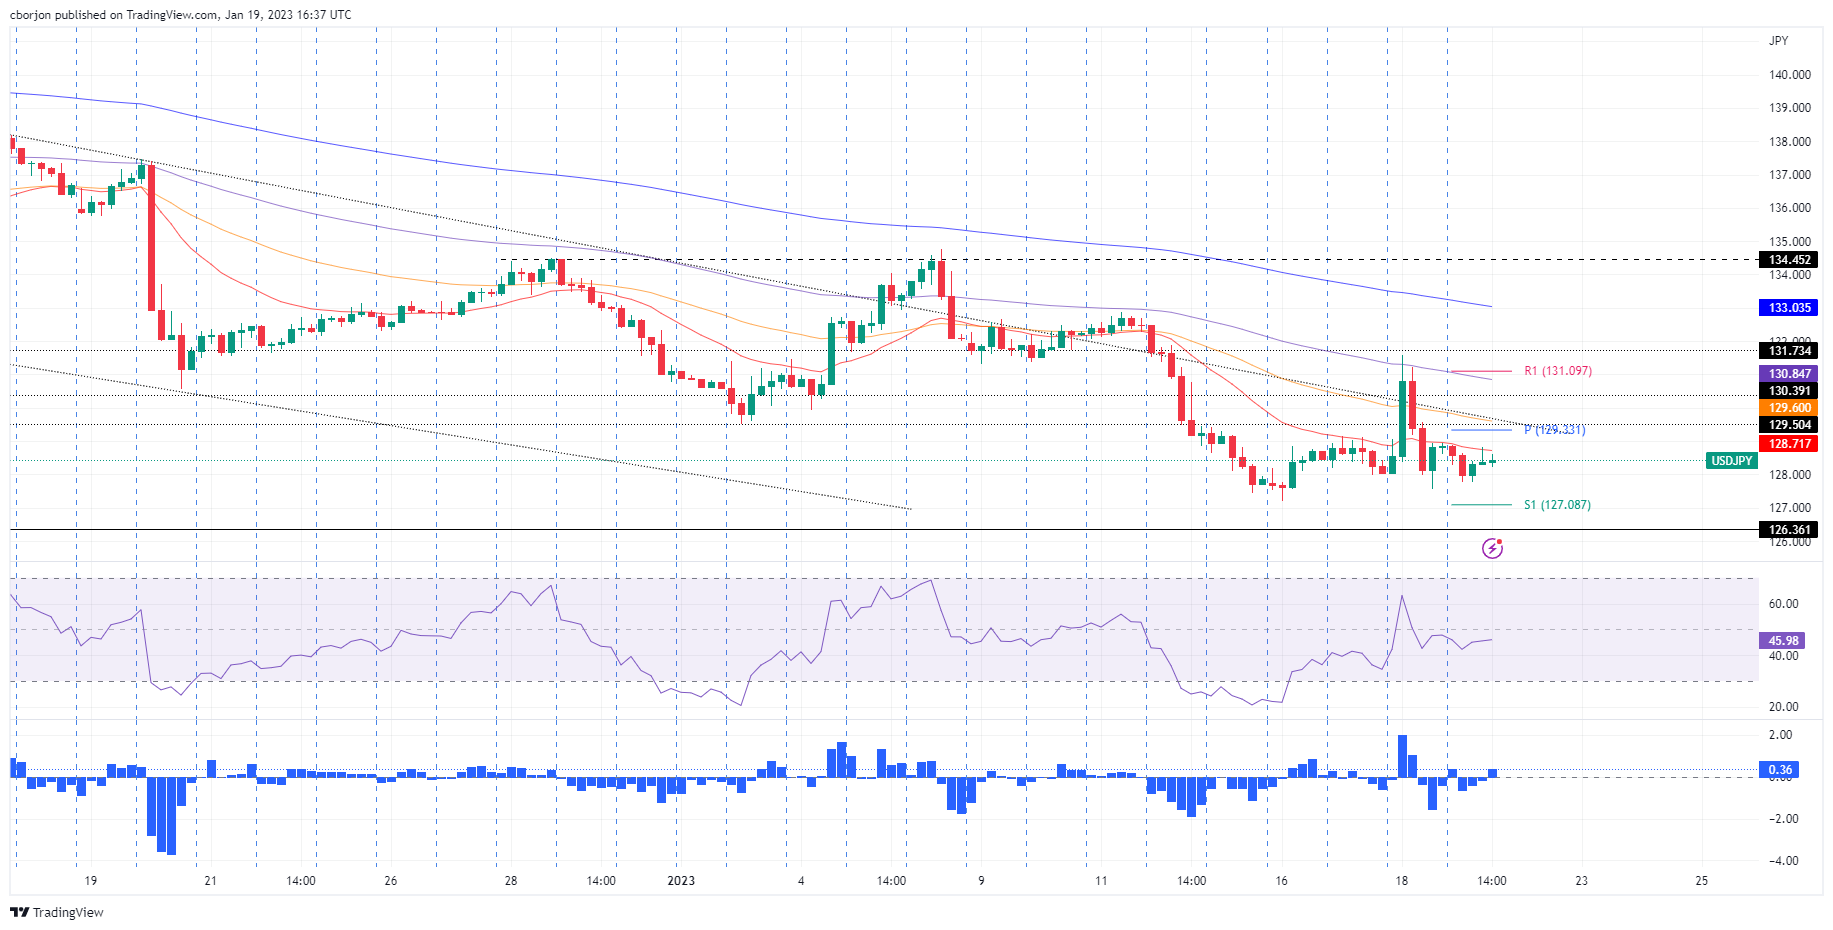
Key USD/JPY Technical Levels
Source: Fx Street
I am Joshua Winder, a senior-level journalist and editor at World Stock Market. I specialize in covering news related to the stock market and economic trends. With more than 8 years of experience in this field, I have become an expert in financial reporting.


